
On Balance Volume is one of the better known volume indicators used in Technical Analysis. OBV or On Balance Volume was popularised by Joseph Granville in his book, “Granville’s New Key to Stock Market Profits”.
On Balance Volume is constructed by assigning a positive or negative number to the day’s volume based on whether price closed higher or lower for the day. For example if volume is say, 1000 shares transacted on a day and the prices closed higher, the volume is assigned a positive value.
In case the price closed lower than it opened, the volume is assigned a negative number. Each days assigned volume number is added to the previous days total to come up with a cumulative running total. This cumulative running total is plotted on a chart as a line and is called On Balance Volume.
OBV can be used to confirm the price trend. The OBV line should ideally move in line with a trending market — either trending higher in line with higher prices or trending lower with lower prices.
In case, the OBV line is not moving in sync with the prices, it can highlight divergence and warn of possible change/reversal in price trend.
With the above in consideration, lets look at whether the OBV had potential to warn us off the BTC price reversal in Nov 2021.
The BTC (Bitcoin) prices had a great run from Nov 2020 to Nov 2021. When we look at the chart of bitcoin prices on a daily timeframe, we see that BTCUSD drove higher from a low of USD 13,629 on the 1st of Nov 2020 to a high of USD 64,895 on 14th April 2021, followed by another wave with the final peak of USD 69,000 on 10th of Nov 2021 before the eventual downturn began.
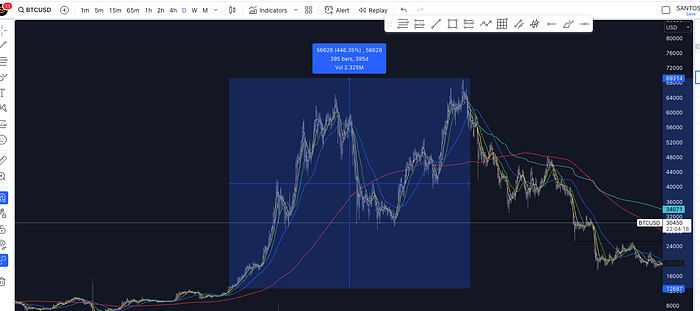

The BTCUSD prices had jumped 446% during this time period. As depicted in the Fig 2, the Bitcoin price peaked for the first time. However, when we look closely at the On Balance Volume, the OBV line had peaked way before in Jan 2021.
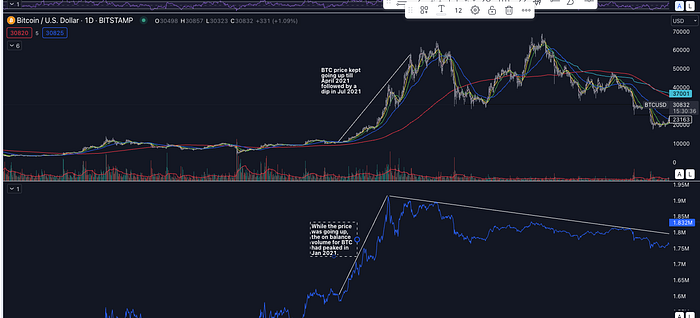

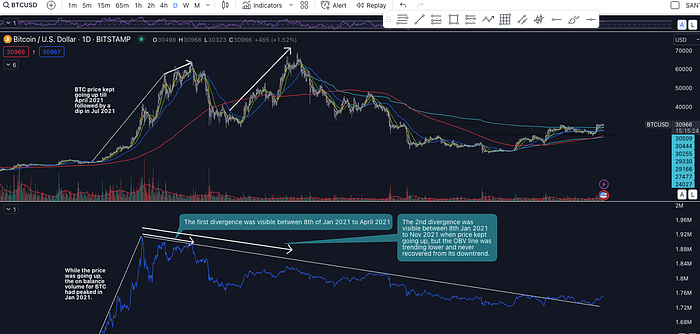
The OBV line was the highest on 8th of Jan 2021 and has been on a downward trajectory ever since. This was despite Bitcoin going on to make another peak in Nov 2021 of 69K USD.
The first divergence was visible between 8th of Jan 2021 to April 2021 highlighting that the reversal was near. From 14th April to 18th Oct 2021, although the OBV and BTCUSD price were moving in tandem, price was making new highs while OBV was in a downward trajectory. This was the 2nd divergence clearly visible on the charts.

When you look at ETH price charts in co-relation to its OBV on OKX, you see a similar pattern as depicted in Fig 4. In fact, we see divergence twice for ETH, once between 23rd July 21 to 10 Nov 21 when the prices peaked at 4,871 USD for ETH while OBV kept on declining.
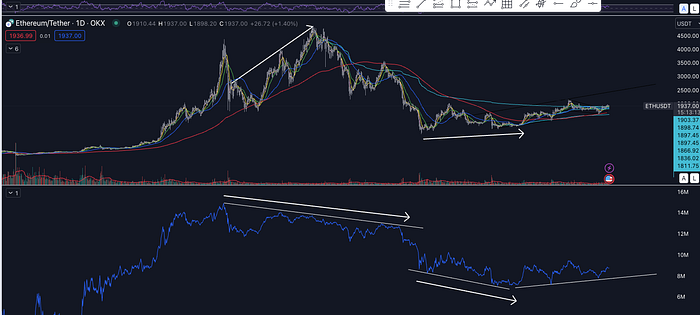

The 2nd time we see the divergence is the most recent between 18 June 2022 and 29th Dec 2022 when we notice that the On Balance Volume was decreasing but the price had stopped going down. Dec 2022 was a reversal and this time towards the bullish side.
Disclaimer
All information in this article is provided for informational and educational purposes only and should not be construed as investment advice. I recommend reaching out to your Financial Advisor for advice regarding your personal circumstance.
Reach out to me at santo@reesaa.com or https://thetwigg.com
References: Technical Analysis of the Financial Markets by John J Murphy.