⏱️ Where can I sell my home the fastest? ⏱️
Homes sell the fastest in Grand Rapids, Michigan, which has the lowest housing inventory among all cities studied at 1.3 months. Buyers must act quickly, and homes are typically purchased within 13 days of being listed.
Cities Where It Takes the Longest to Sell, Ranked | Slowest-Selling Cities | Fastest-Selling Cities | States Where It Takes the Longest to Sell, Ranked | Slowest-Selling States | Fastest-Selling States | Rankings by Category
The U.S. housing market has changed dramatically in the past five years. Low mortgage rates in the wake of the pandemic gave rise to fierce demand for homes that ushered in one of the hottest seller’s markets in history.
Yet just a few years later, mortgage rates have swung in the other direction, and sellers are seeing their advantage diminish. Cost-conscious buyers are no longer willing to recklessly purchase expensive properties, and as a result, homes are taking much longer to sell in some markets.
To determine where homes are taking the longest to sell, we analyzed market data from the 50 most-populous U.S. metros.
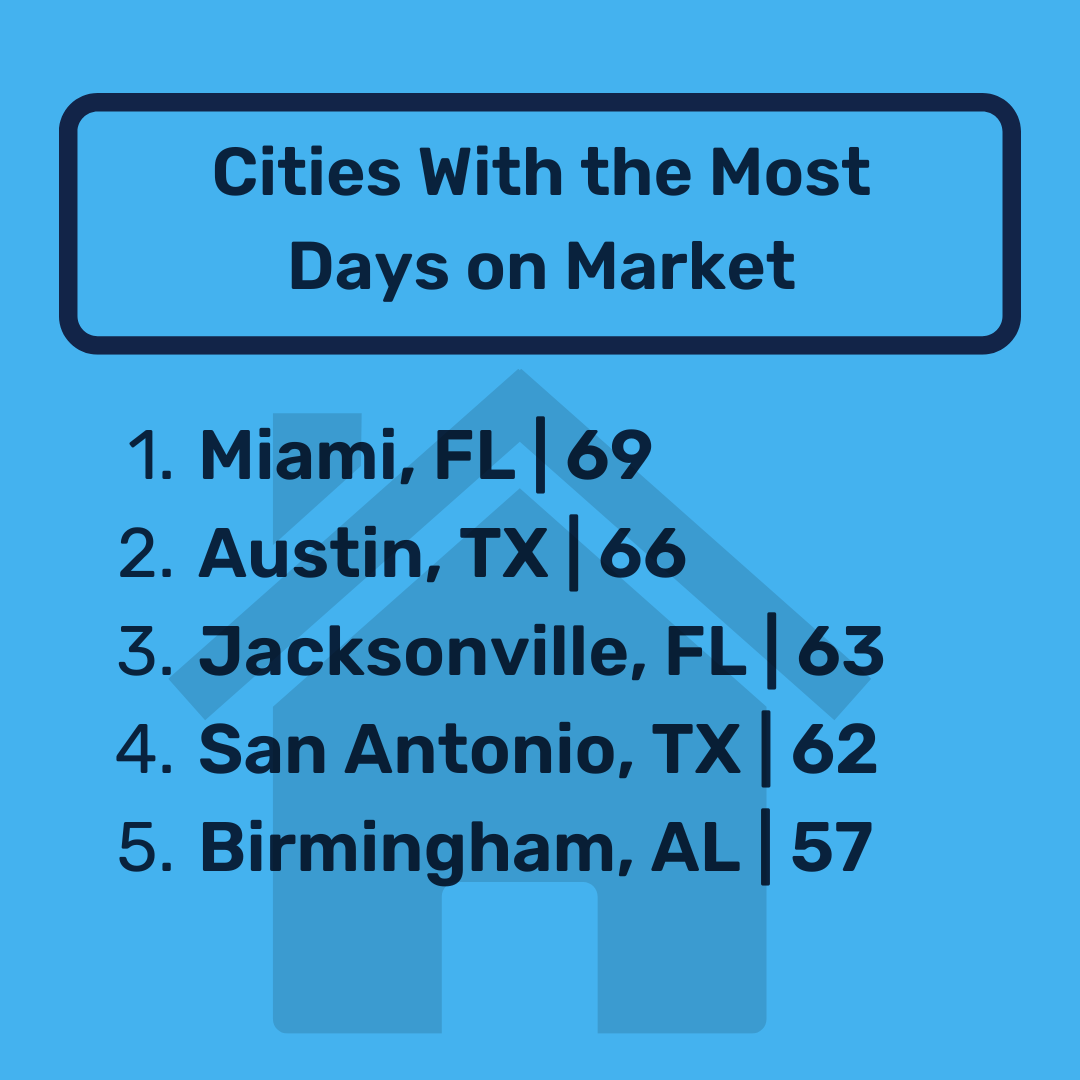
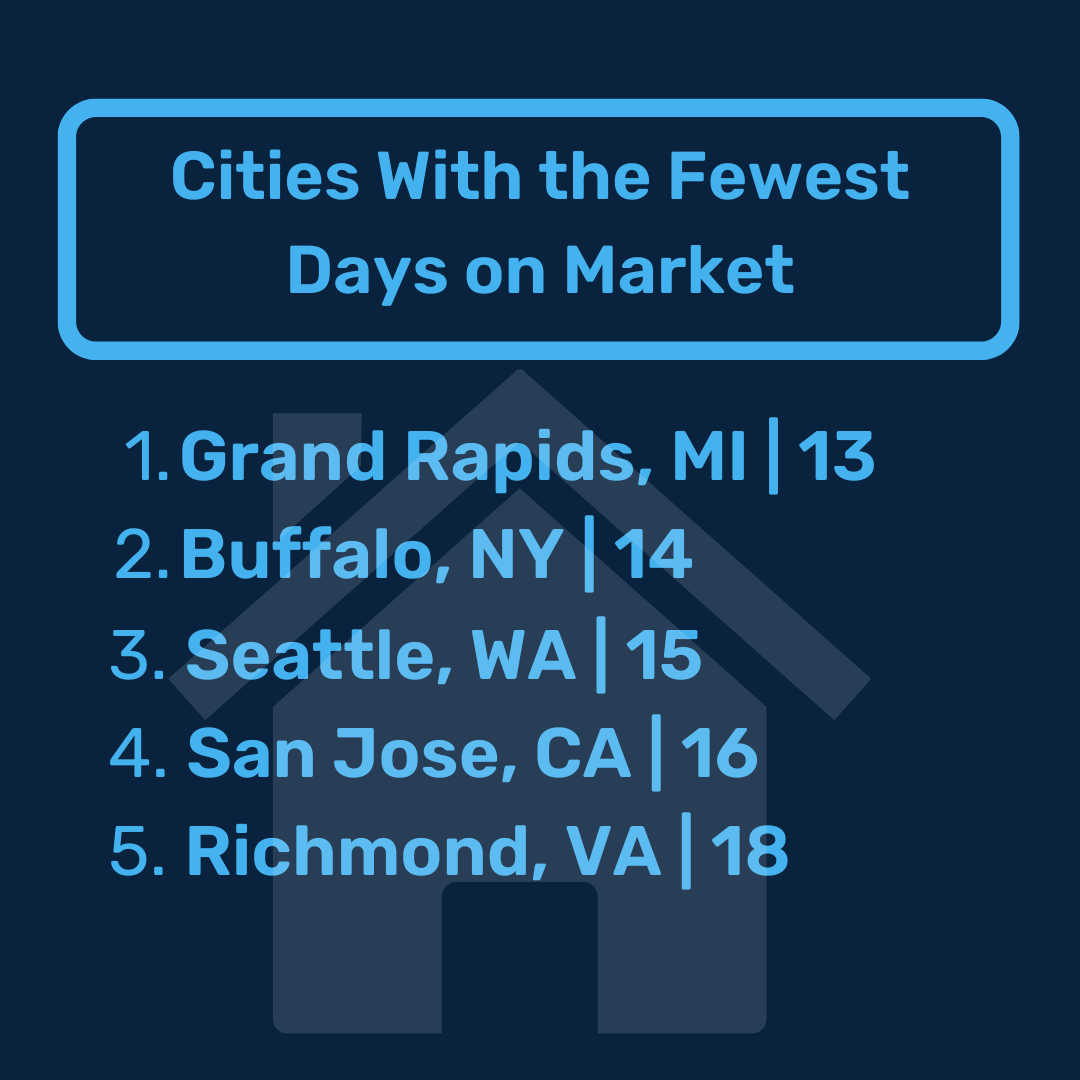
We found that homes sell the slowest in Miami thanks to a surplus of inventory that causes properties to sit on the market for a median of 69 days. Meanwhile, homes sell the fastest in Grand Rapids, Michigan, where homes tend to be purchased within 13 days of listing.
Keep reading to find out if your city remains a housing hotspot or is cooling down.
🏡 Cities Where it Takes the Longes to Sell Statistics
- Among the 50 most-populous U.S. cities, homes sell the slowest in Miami and the fastest in Grand Rapids, Michigan.
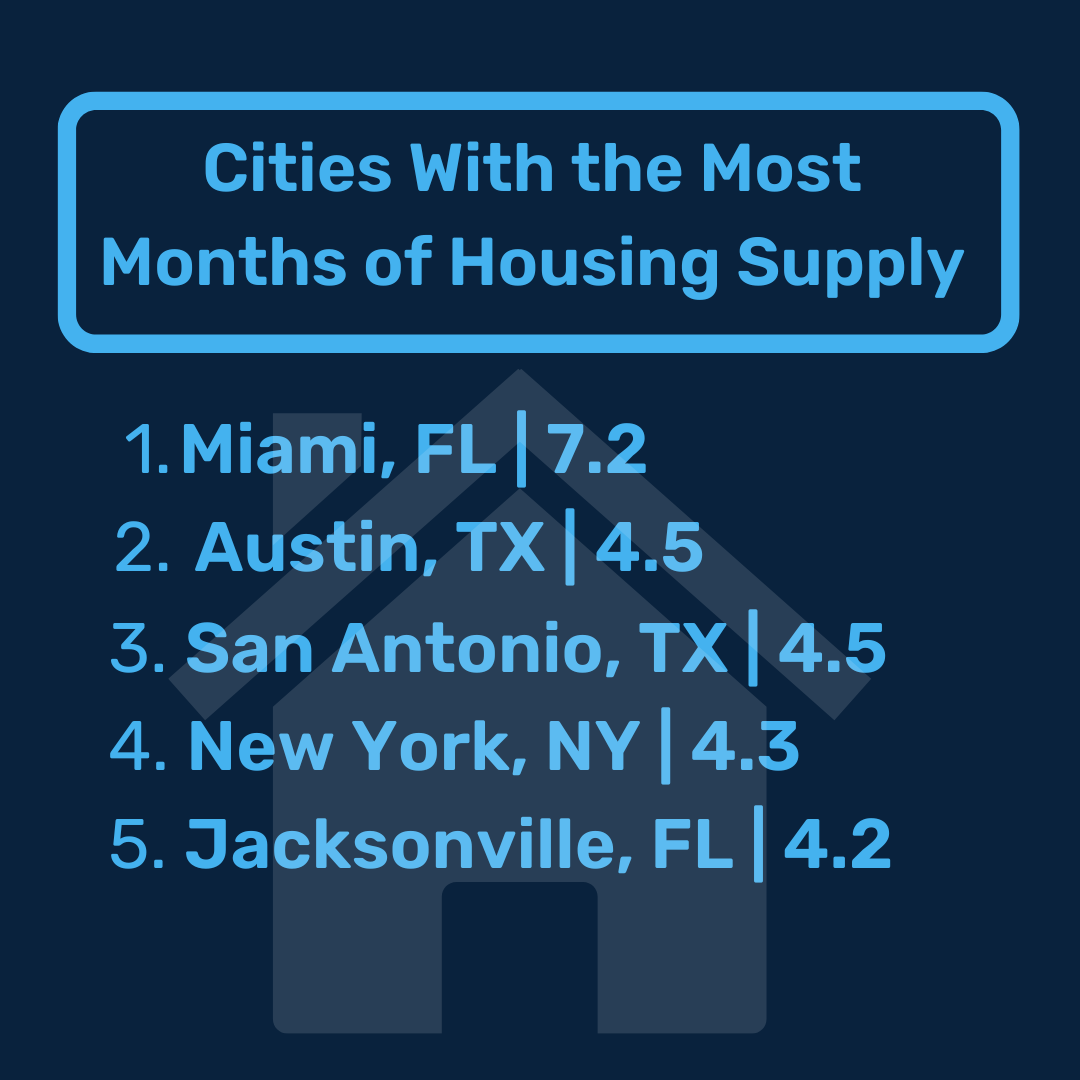
- Miami has the largest surplus of homes, and it would take 7.2 months to sell all the available inventory.
- Miami homes sit on the market for a median of 69 days — the longest duration among all cities studied.
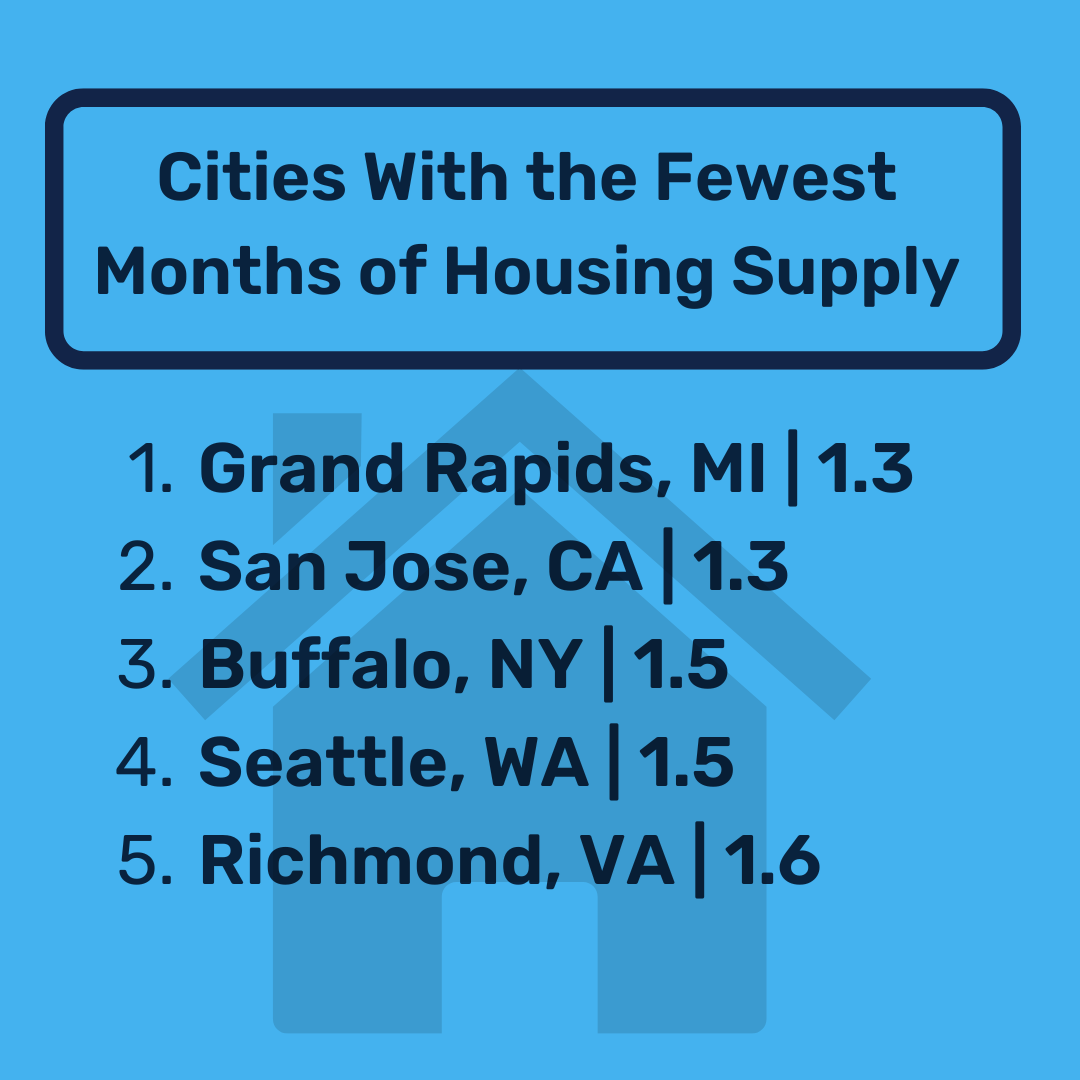
- With just 1.3 months of housing supply — the lowest among all cities studied — the typical Grand Rapids home spends the least amount of time on the market at just 13 days.
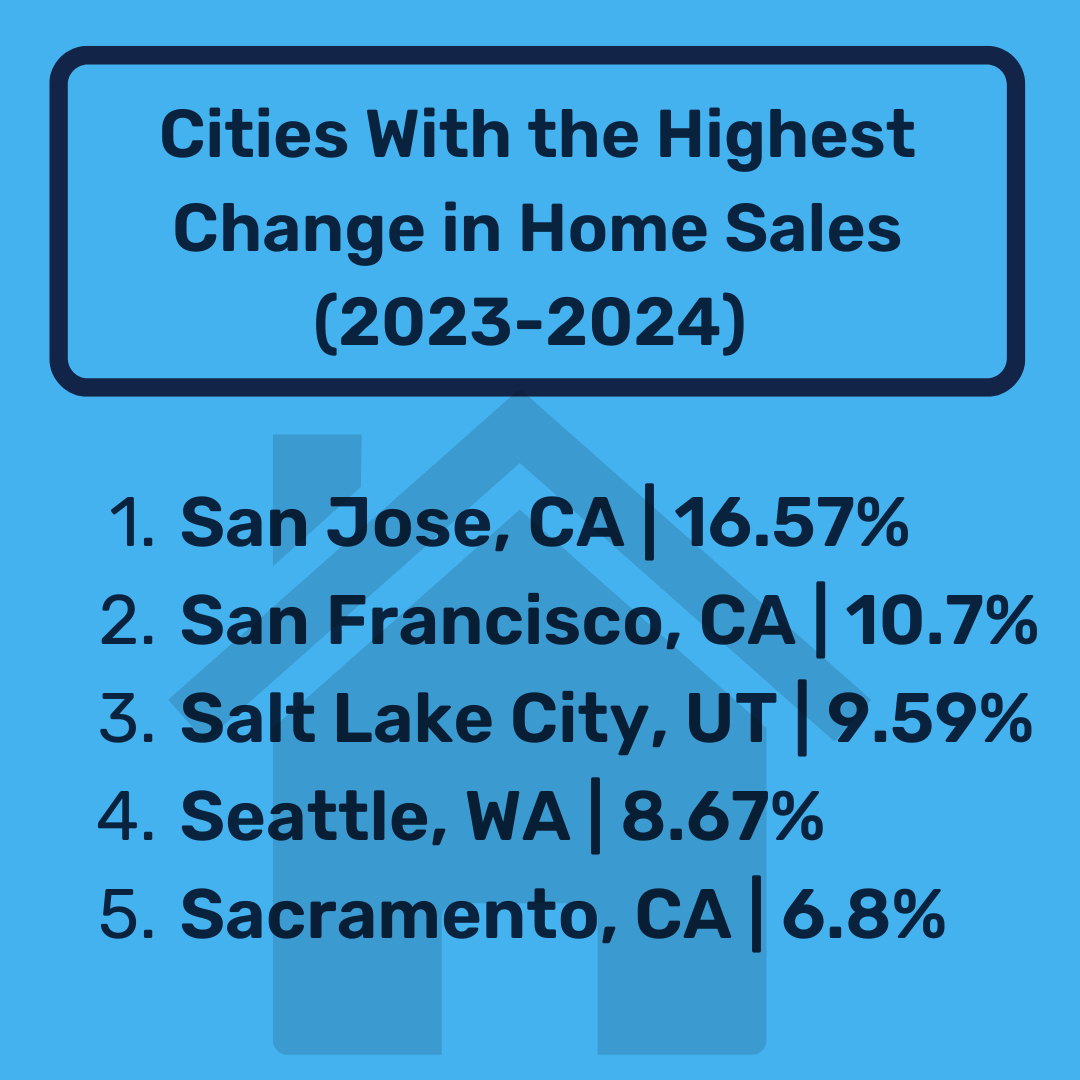
- The number of homes sold in San Jose, California, rose by 16.57% from 2023 to 2024 — marking the largest increase among all 50 cities.
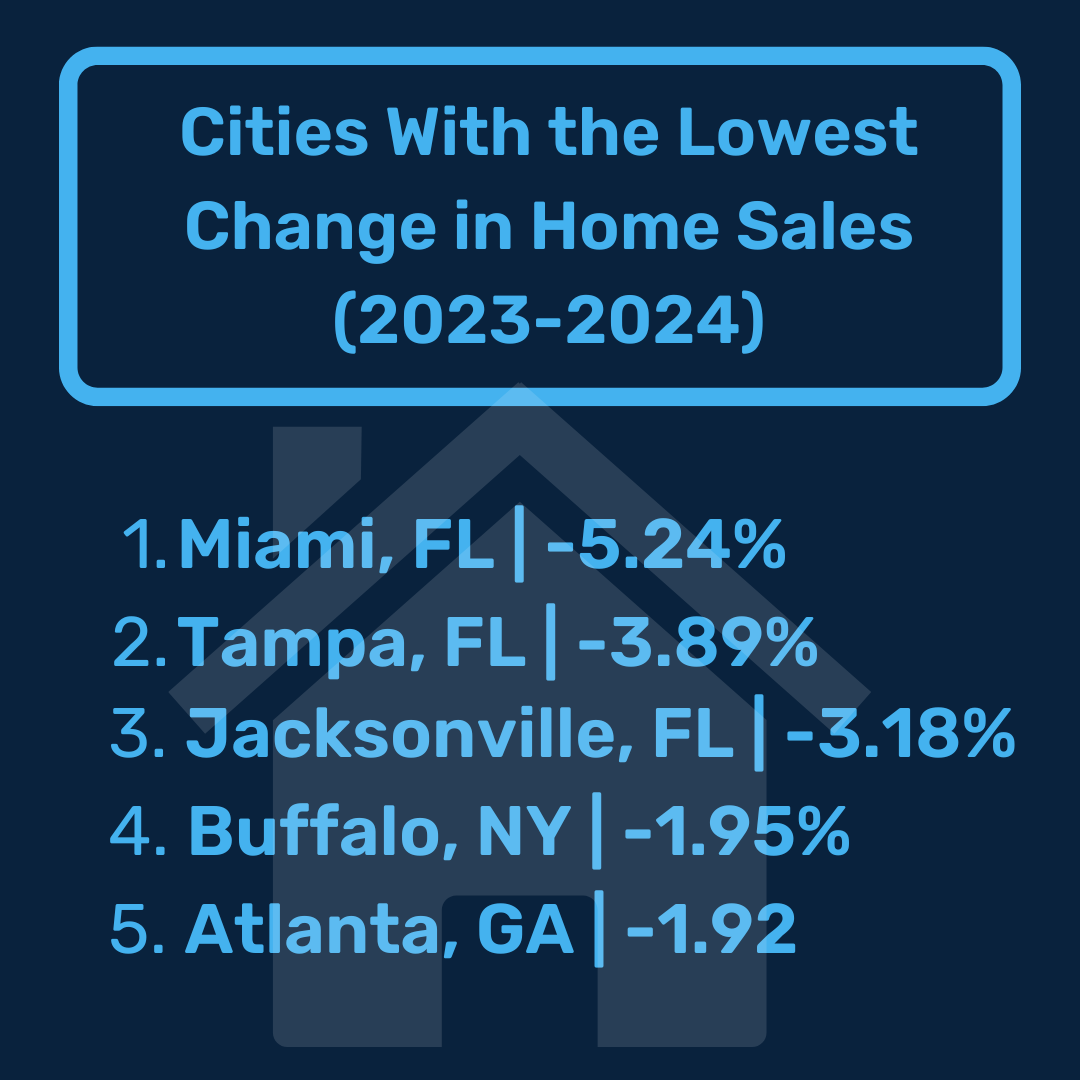
- Miami experienced the greatest decline, with the number of homes sold plummeting 5.24% over the same time period.
- Among states, homes sell the slowest in Hawaii and the fastest in Massachusetts.
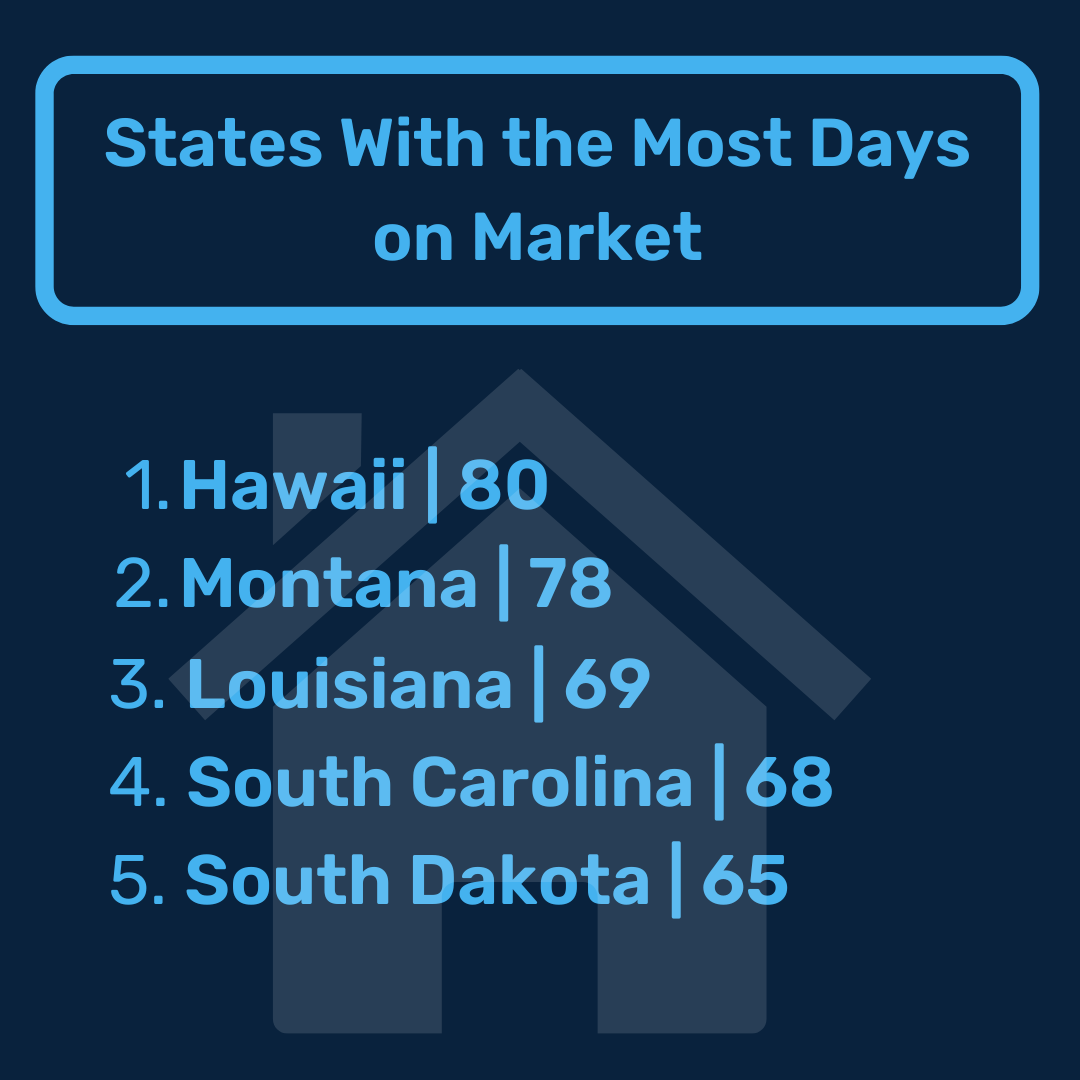
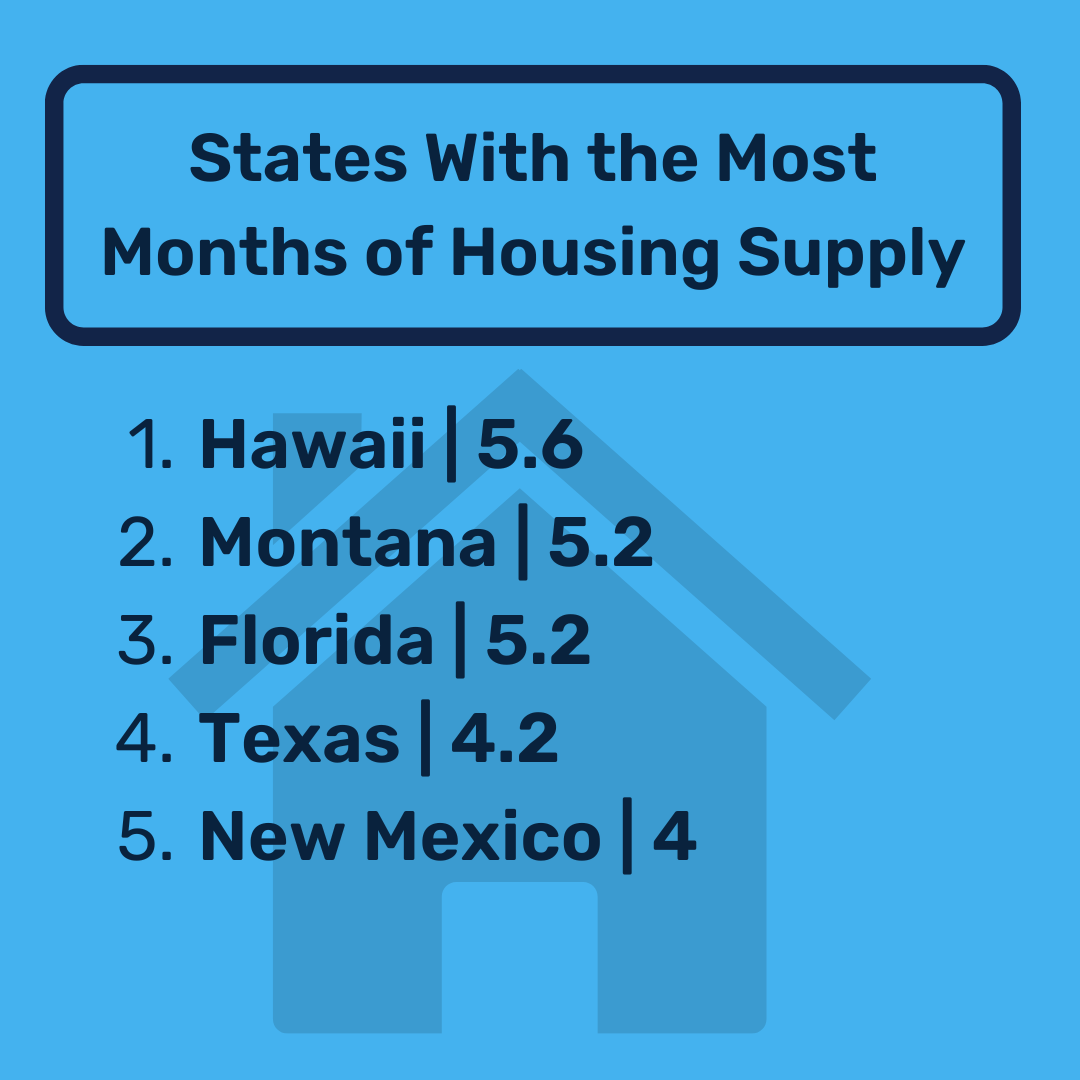
- Hawaii has the most housing inventory with 5.6 months of supply, causing properties to sit on the market for about 80 days — the longest duration among states.
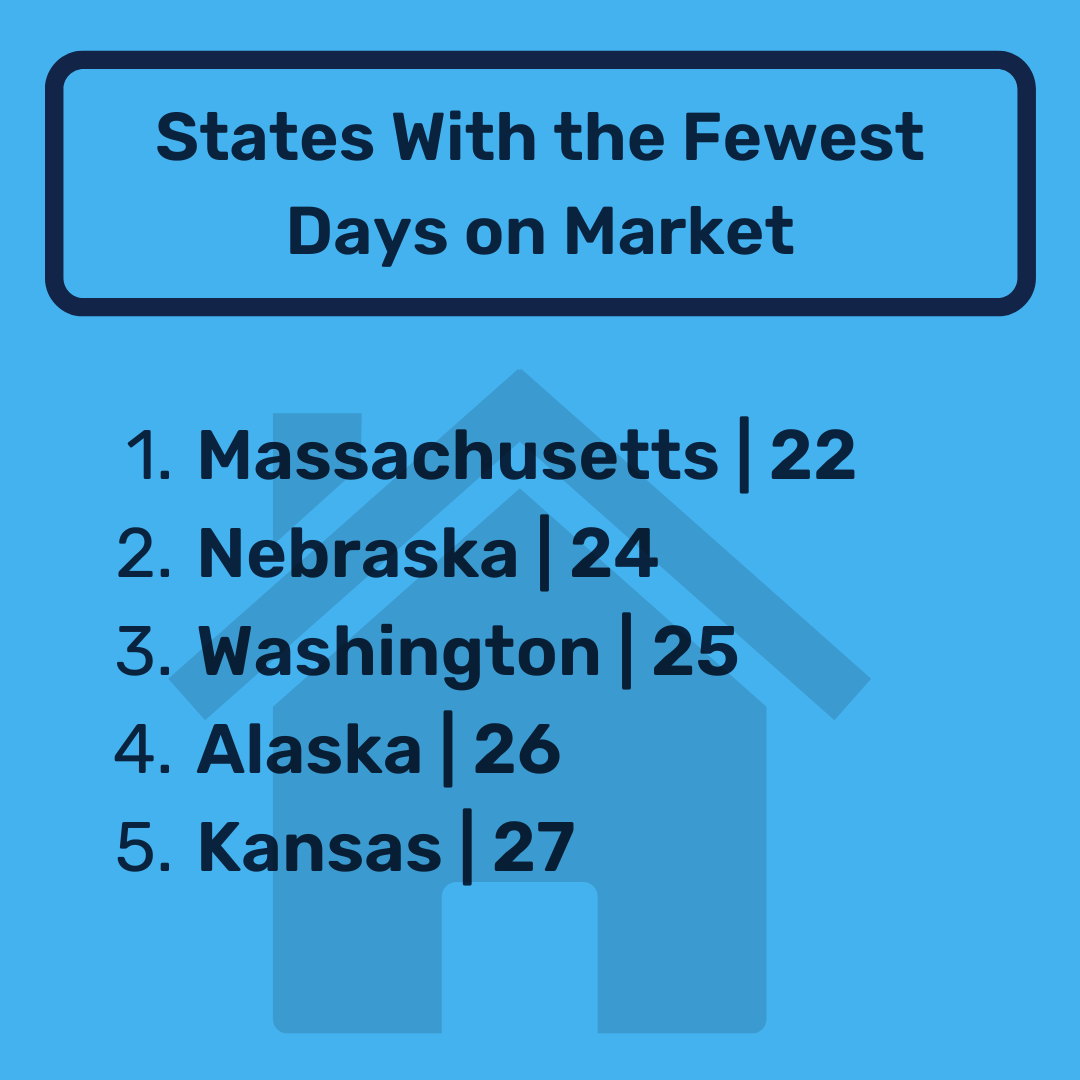
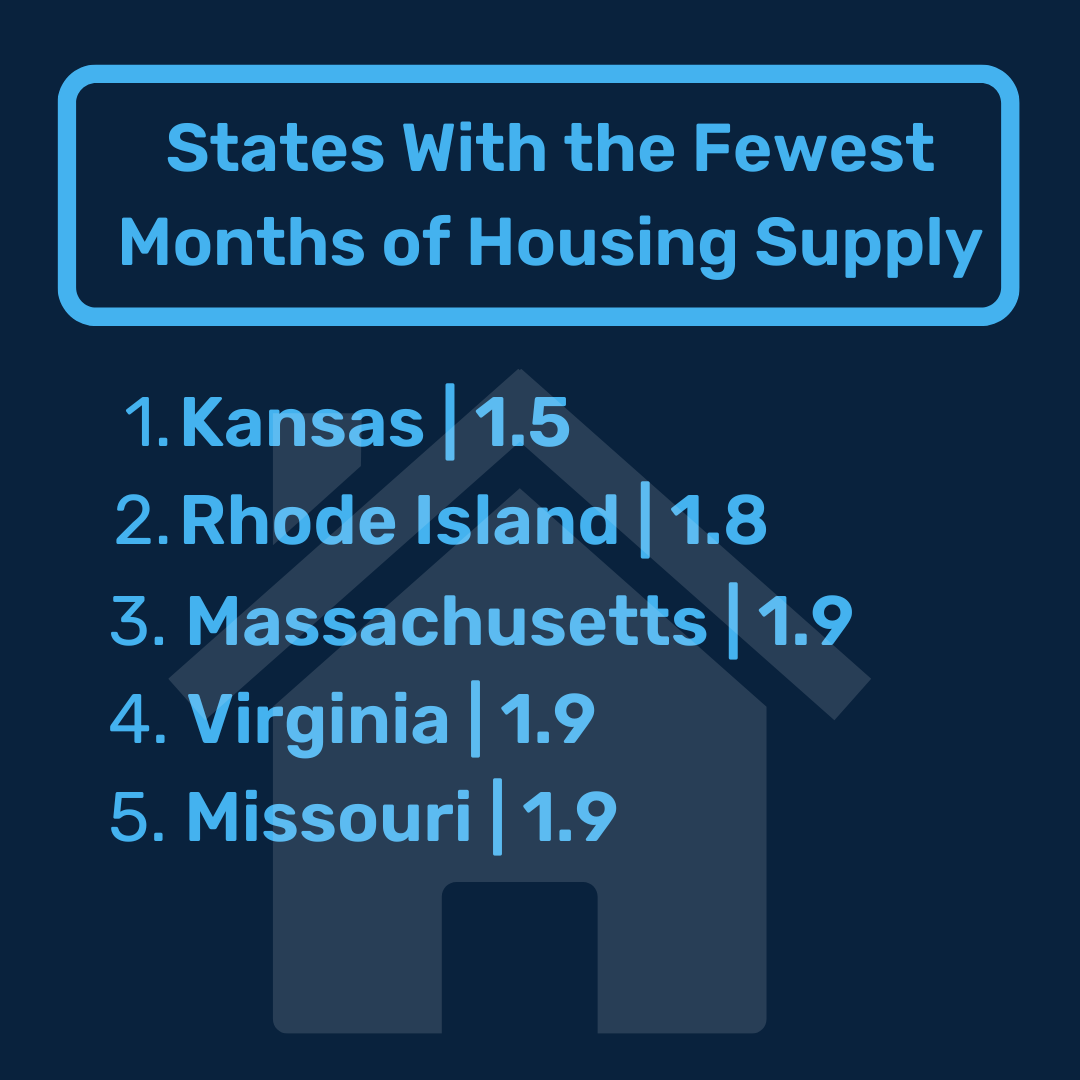
- Kansas has the least amount of inventory, with just 1.5 months of supply. However, homes spend the fewest days on the market in Massachusetts with a median of 22 days.
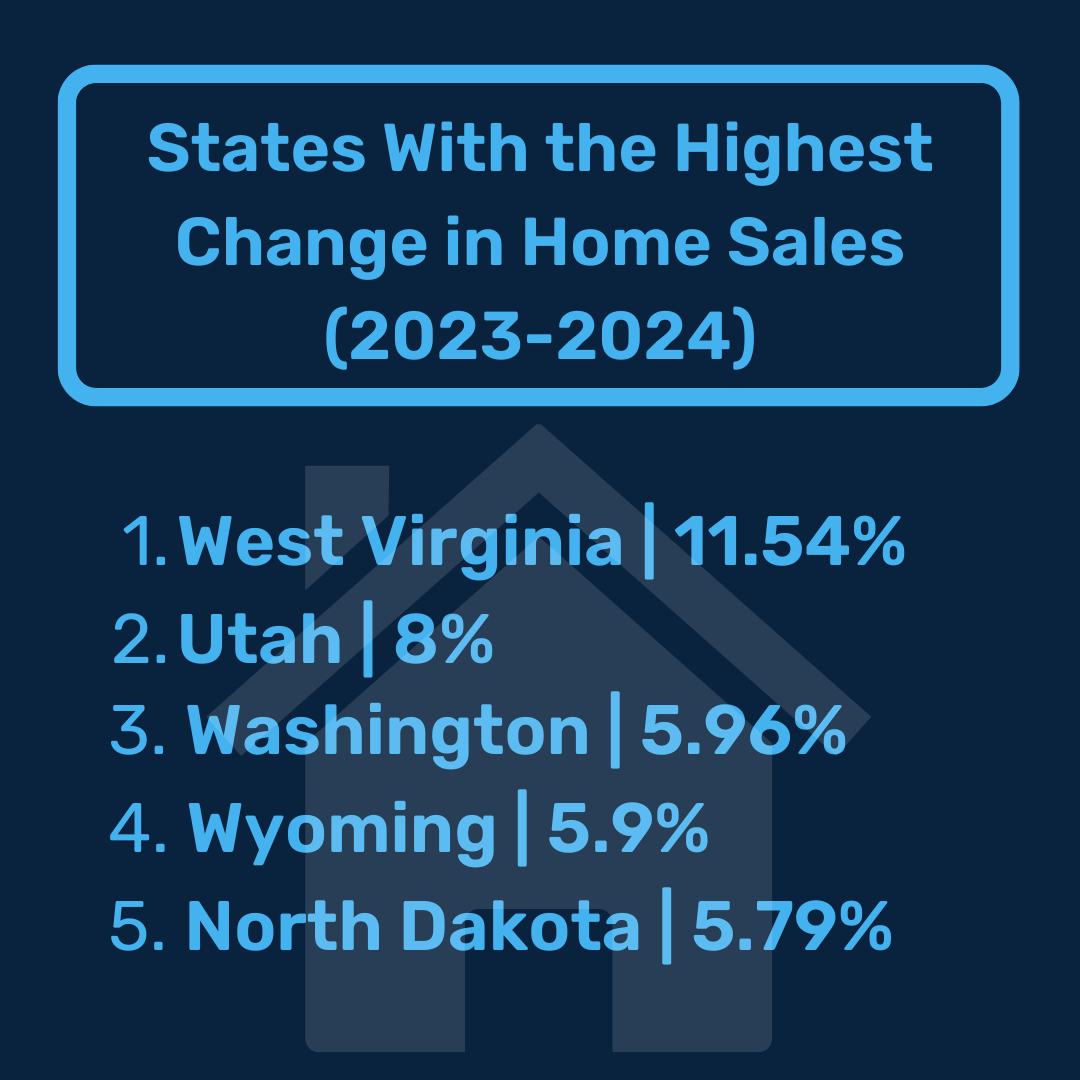
- West Virginia experienced the most growth in number of homes sold from 2023 to 2024, increasing 11.54%.
Cities Where It Takes the Longest to Sell, Ranked
!function(e,n,i,s){var d=”InfogramEmbeds”;var o=e.getElementsByTagName(n)[0];if(window[d]&&window[d].initialized)window[d].process&&window[d].process();else if(!e.getElementById(i)){var r=e.createElement(n);r.async=1,r.id=i,r.src=s,o.parentNode.insertBefore(r,o)}}(document,”script”,”infogram-async”,”https://e.infogram.com/js/dist/embed-loader-min.js”);
| Rank | Metro | Median Days on Market, 2024 | Months of Housing Supply, 2024* | Median Sale Price, 2024 | Median Household Income, 2023 | Change in Homes Sold, 2023-2024 |
| – | Metro Average | 37 | 2.8 | $470,000 | $86,462 | 1.75% |
| 1 | Miami, FL | 69 | 7.2 | $550,000 | $76,271 | -5.24% |
| 2 | Austin, TX | 66 | 4.5 | $444,000 | $98,508 | -0.65% |
| 3 | Jacksonville, FL | 63 | 4.2 | $375,000 | $77,044 | -3.18% |
| 4 | San Antonio, TX | 62 | 4.5 | $308,000 | $73,195 | 1.54% |
| 5 | Birmingham, AL | 57 | 3.5 | $286,000 | $69,284 | 1.07% |
| 6 | Nashville, TN | 56 | 3.5 | $460,000 | $84,685 | 1.94% |
| 7 | Pittsburgh, PA | 55 | 3.4 | $231,000 | $72,532 | -1.56% |
| 8 | New York, NY | 55 | 4.3 | $737,000 | $95,220 | -1.89% |
| 9 | Phoenix, AZ | 54 | 3.5 | $459,000 | $85,700 | -0.35% |
| 10 | Chicago, IL | 53 | 2.9 | $345,000 | $87,071 | -1.22% |
| 11 | Charlotte, NC | 50 | 2.9 | $401,000 | $81,262 | 0.75% |
| 12 | Riverside, CA | 45 | 3.4 | $578,000 | $87,843 | 2.37% |
| 13 | Memphis, TN | 44 | 3.4 | $279,000 | $64,025 | 0.71% |
| 14 | Dallas, TX | 44 | 3.5 | $421,000 | $86,860 | 2.78% |
| 15 | Las Vegas, NV | 44 | 2.8 | $439,000 | $75,065 | 4.95% |
| 16 | Houston, TX | 43 | 3.8 | $339,000 | $79,463 | 0.52% |
| 17 | Milwaukee, WI | 43 | 2.1 | $321,000 | $77,006 | 2.81% |
| 18 | Columbus, OH | 43 | 2.2 | $336,000 | $77,390 | 2.50% |
| 19 | Philadelphia, PA | 42 | 3.3 | $280,000 | $86,867 | -0.02% |
| 20 | Orlando, FL | 42 | 3.8 | $405,000 | $77,378 | -1.24% |
| 21 | Atlanta, GA | 42 | 3.4 | $397,000 | $86,505 | -1.92% |
| 22 | Tampa, FL | 41 | 3.8 | $376,000 | $72,743 | -3.89% |
| 23 | Los Angeles, CA | 41 | 3.2 | $894,000 | $91,960 | 4.75% |
| 24 | Salt Lake City, UT | 39 | 2.5 | $527,000 | $94,409 | 9.59% |
| 25 | Cincinnati, OH | 34 | 2.1 | $286,000 | $77,844 | 3.84% |
| 26 | Washington, DC | 32 | 2 | $562,000 | $121,469 | 2.55% |
| 27 | Oklahoma City, OK | 32 | 2.9 | $262,000 | $69,895 | 3.69% |
| 28 | Kansas City, MO | 30 | 2.3 | $324,000 | $79,842 | 2.20% |
| 29 | Minneapolis, MN | 30 | 2.1 | $378,000 | $95,102 | 2.72% |
| 30 | Raleigh, NC | 30 | 2.2 | $440,000 | $96,096 | -1.66% |
| 31 | Louisville, KY | 29 | 2 | $268,000 | $68,921 | 1.33% |
| 32 | Virginia Beach, VA | 29 | 2 | $348,000 | $79,325 | -0.78% |
| 33 | Portland, OR | 29 | 2.5 | $548,000 | $94,925 | 5.38% |
| 34 | Denver, CO | 27 | 2.4 | $586,000 | $103,055 | 0.27% |
| 35 | Baltimore, MD | 26 | 1.9 | $384,000 | $94,289 | 1.35% |
| 36 | Providence, RI | 26 | 1.8 | $480,000 | $83,330 | 2.41% |
| 37 | San Francisco, CA | 25 | 2.3 | $1,497,000 | $127,792 | 10.70% |
| 38 | Cleveland, OH | 25 | 1.9 | $221,000 | $67,586 | -1.09% |
| 39 | St. Louis, MO | 25 | 1.8 | $261,000 | $78,224 | -0.11% |
| 40 | Detroit, MI | 24 | 2.5 | $189,000 | $72,574 | -1.06% |
| 41 | Fresno, CA | 23 | 2.1 | $414,000 | $71,140 | -0.03% |
| 42 | San Diego, CA | 23 | 2.1 | $901,000 | $103,674 | 6.08% |
| 43 | Sacramento, CA | 23 | 2.1 | $583,000 | $94,992 | 6.80% |
| 44 | Indianapolis, IN | 21 | 1.9 | $301,000 | $77,947 | 0.31% |
| 45 | Boston, MA | 21 | 1.8 | $716,000 | $110,697 | 3.24% |
| 46 | Richmond, VA | 18 | 1.6 | $393,000 | $84,332 | 1.45% |
| 47 | San Jose, CA | 16 | 1.3 | $1,545,000 | $153,202 | 16.57% |
| 48 | Seattle, WA | 15 | 1.5 | $823,000 | $110,744 | 8.67% |
| 49 | Buffalo, NY | 14 | 1.5 | $250,000 | $69,861 | -1.95% |
| 50 | Grand Rapids, MI | 13 | 1.3 | $334,000 | $77,979 | -0.38% |
| *The number of months it would take to sell all the housing inventory in a metro at the current rate of sale. | ||||||
Top 10 Slowest-Selling Cities
The amount of time it takes to sell a home depends on a variety of local market conditions, but there is a strong correlation between the amount of inventory and the speed of sales.
In the typical U.S. city, it would take 2.8 months to sell all the available homes on the market. But sales in the 10 slowest-selling markets take longer, with supply lasting a median 3.5 months.
With so much inventory, buyers have more options and feel less pressure to purchase a home quickly. As a result, homes sit on the market longer. In the 10 slowest-selling markets, homes sit on the market for a median of 57 days, compared to 37 days nationwide.
This extended time on the market shows weak buyer demand, which is reflected in declining home sales across these metros. From 2023 to 2024, the number of home sales decreased in seven of the 10 slowest-selling markets.
Of the three cities that experienced growth (San Antonio, Birmingham, and Nashville), only Nashville surpassed the national rate of 1.75%.
These sluggish conditions are most prominent in the South, where seven of the 10 slowest-selling metros are located. But they are also present in markets across the East Coast, Mid-Atlantic, and Midwestern regions.
The cities where homes take the longest to sell are:
1. Miami, Florida: The number of homes sold in Miami plummeted 5.24% from 2023 to 2024 — marking the largest decline among all 50 cities studied. Demand has likely dropped because of a historic lack of affordability. The median home costs $550,000, which is about 17% more than the national median of $470,000. As a result, Miami homes sit on the market for a median of 69 days — the longest duration among all cities studied.
2. Austin, Texas: The capital of the Lone Star State was once one of the hottest housing markets in the country, but it slowed from 2023 to 2024 with the number of home sales declining 0.65%. There’s now so much inventory in the local market it would take 4.5 months to sell it all at the current pace, and homes sit on the market for about 66 days — the second-longest duration among all studied cities.
3. Jacksonville, Florida: Florida’s largest city is home to the second-slowest housing market in the state and the third-slowest housing market in the U.S. Jacksonville homes sit on the market for a median of 63 days, leading to 4.2 months of housing supply. It’s no wonder the number of homes sold in Jacksonville decreased by 3.18% from 2023 to 2024. That’s the third-highest rate of decline among all cities studied, with Jacksonville coming in behind its southern neighbors, Miami and Tampa.
4. San Antonio, Texas: Despite a median home price of $308,000 — 34% lower than the national median of $470,000 — homes in San Antonio continue to sit on the market. The median days on market in San Antonio is the fourth-highest among all cities studied at 62 days. San Antonio is also tied with Austin for the second-most months of housing supply with 4.5 months.
5. Birmingham, Alabama: With a median home price of $286,000, Birmingham has more affordable homes than other major metro areas. However, housing may still be out of reach for local residents, who earn the fourth-lowest median household income at $69,284. That could be why typical Birmingham homes sit on the market for 57 days — the fifth-longest duration among all cities studied. Birmingham also has about 3.5 months of housing supply, compared to 2.8 in the average U.S. city.
6. Nashville, Tennessee: Nashville’s housing market has boomed in recent years as the population exploded, but it appears home buyers are fed up with the high prices, traffic congestion, and overtourism. Homes sit on the market for a median of 56 days in Nashville, compared to 37 days nationwide. What’s more, there’s enough inventory in the market to last 3.5 months, compared to 2.8 months across the U.S.
7. Pittsburgh, Pennsylvania: Pittsburgh’s housing market is slowing down, with homes taking a median of 55 days to sell, compared to 37 across the U.S. The extended time on market is likely due to a surplus of homes, which lowers home shoppers’ urgency to buy. Pittsburgh has about 3.4 months of housing supply, while the median U.S. city has 2.8. As a result, Pittsburgh home sales declined by 1.56% from 2023 to 2024.
8. New York City, New York: Home prices remain high in New York City, with the median home costing the fourth-most among all cities studied at $737,000. Although buyers have recently gained more leverage in the market, few are willing to spend that much on a home, leading to 4.3 months of housing supply — the fourth-most among all cities studied. Consequently, home sales declined 1.89% from 2023 to 2024 — the sixth-highest rate among all cities studied.
9. Phoenix, Arizona: Sellers have lost their advantage in Phoenix as homes start to linger on the market. The Valley of the Sun has 3.5 months of housing supply — compared to 2.8 in the typical U.S. city — and the median home sits on the market for 54 days. That’s led to a slight slowdown, with the number of home sales decreasing 0.35% from 2023 to 2024.
10. Chicago, Illinois: Despite a median home price of $345,000 — 27% lower than the national median of $470,000 — the number of homes sold in Chicago declined by 1.22% from 2023 to 2024. Rather than price, other factors — such as home conditions, local amenities, and neighborhood desirability — may contribute to longer home sales in Chicago. Overall, homes sit on the market for about 53 days, compared to 37 days nationwide.
Top 10 Fastest-Selling Cities
Although many U.S. markets are cooling, there are pockets of real estate across the country that remain as hot as ever. The fastest-selling markets span the country, with clusters predominantly on the East and West coasts.
Homes in the fastest-selling cities spend a median of 20 days on the market, compared to 37 days in the typical U.S. city.
In general, those markets are driven by affluent buyers who have the purchasing power to buy expensive properties, even during market fluctuations that negatively affect other buyers.
For instance, residents in Seattle, San Jose, San Diego, and Boston all earn median annual salaries of more than $100,000. Despite homes in those metros costing about 2x the national median, they are all in the top 10 markets where homes sell the fastest.
The full list of metros where homes sell the fastest includes:
1. Grand Rapids, Michigan: Grand Rapids has one of the most affordable housing markets in the country, with the median home costing $334,000 — about 29% lower than the national median of $470,000. Buyers are eager to snag these affordable homes, which sit on the market for just 13 days. That’s the shortest duration among all cities studied. With homes selling so quickly, Grand Rapids has the least amount of housing inventory among all cities studied with just 1.3 months.
2. Buffalo, New York: Unlike its in-state neighbor, Buffalo’s housing market is booming. Homes fly off the market in just 14 days, and it would take only 1.5 months to sell all the available homes in the market. For comparison, homes in Buffalo sell about 4x faster and the supply clears 3x faster than in New York City. Affordable home prices drive fierce demand in Buffalo. The median-priced home costs just $250,000, which is about half the $470,000 the median-priced U.S. home costs.
3. Seattle, Washington: Although the median home in Seattle costs $823,000 — the fifth-highest price among all cities studied — the housing market continues to boom. The number of homes sold in the Emerald City increased 8.67% from 2023 to 2024, compared to 1.75% nationwide. Today, homes sit on the market for a median of just 15 days. Although this market isn’t affordable for every buyer, it’s feasible for Seattle residents, who earn the fourth-highest annual income at $110,744.
4. San Jose, California: The number of homes sold in San Jose rose by 16.57% from 2023 to 2024 — marking the largest increase among all 50 cities. Affluent buyers are driving demand in the expensive San Jose housing market. Residents bring home the highest median salary at $153,202 annually, allowing them to compete more aggressively for homes in markets with limited inventory. Although San Jose has the most expensive median home price at $1.5 million, the housing market has just 1.3 months of housing supply, and homes sit on the market for a median of just 16 days.
5. Richmond, Virginia: This Sun Belt city may not seem like a housing hotspot, but homes sell in about 18 days, compared to 37 days in the typical city. With buyers quickly snapping up properties, the city has just 1.6 months of housing supply — the third-lowest amount among all cities studied. It’s no surprise, then, that the Richmond housing market experienced a 1.45% increase in home sales from 2023 to 2024.
6. Boston, Massachusetts: While the typical U.S. city has 2.8 months of housing supply, Boston has just 1.8. As a result, Boston properties tend to sell quickly. Typical homes sit on the market for 21 days, compared to 37 days nationwide. The lack of inventory has kept prices high at $716,000, but with the fifth-highest median salary of $110,697, residents may find home buying more attainable. In fact, Boston home sales increased 3.24% from 2023 to 2024.
7. Indianapolis, Indiana: Indianapolis’ housing market attracts buyers looking for a more affordable lifestyle. The median home costs $301,000, which is about 36% less than the median U.S. home price of $470,000. Buyers competing for these affordable homes has led to a slight uptick in home sales, with the number increasing 0.31% from 2023 to 2024. Today, homes sit on the market for a median of 21 days, and it would take just 1.9 months to sell all the available homes on the market.
8. Sacramento, California: Sacramento is the third-hottest real estate market in California and the fifth-hottest real estate market in the U.S. based on home sale growth from 2023 to 2024. During that time, home sales increased 6.8%, leading to a shortage of homes in the capital city. The city has just 2.1 months of housing supply. The housing shortage, in turn, has led to faster home sales. Sacramento homes sit on the market a median of 23 days, well below the 37-day nationwide median.
9. San Diego, California: With its year-round warm weather and beautiful beaches, it’s no surprise San Diego is a highly desirable market for home buyers. Homes sell in about 23 days, and it would take just 2.1 months to sell all the available inventory in the market. For comparison, homes in the typical U.S. city sell in about 37 days, and it would take 2.8 months to sell all the available homes. Although San Diego homes cost almost double the national median at $901,000, local residents can sustain the fast-moving market by bringing home the sixth-highest median salary at $103,674. As a result, home sales increased by 6.08% from 2023 to 2024.
10. Fresno, California: With homes costing $414,000, Fresno is one of the few California cities where the typical home price is less than the U.S. median of $470,000. Americans who want to buy in this pocket of affordability need to act fast, though. The median home sells within 23 days in Fresno, compared to 37 days nationwide. There are also fewer homes to choose from, with just 2.8 months of housing supply.
States Where It Takes the Longest to Sell, Ranked
!function(e,n,i,s){var d=”InfogramEmbeds”;var o=e.getElementsByTagName(n)[0];if(window[d]&&window[d].initialized)window[d].process&&window[d].process();else if(!e.getElementById(i)){var r=e.createElement(n);r.async=1,r.id=i,r.src=s,o.parentNode.insertBefore(r,o)}}(document,”script”,”infogram-async”,”https://e.infogram.com/js/dist/embed-loader-min.js”);
| Rank | State | Median Days on Market, 2024 | Months of Housing Supply, 2024* | Median Sale Price, 2024 | Median Household Income, 2023 | Change in Homes Sold, 2023-2024 |
| – | National Average | 40 | 2.8 | $428,000 | $77,719 | 1.07% |
| 1 | Hawaii | 80 | 5.6 | $771,000 | $95,322 | -0.58% |
| 2 | Montana | 78 | 5.2 | $521,000 | $70,804 | 3.67% |
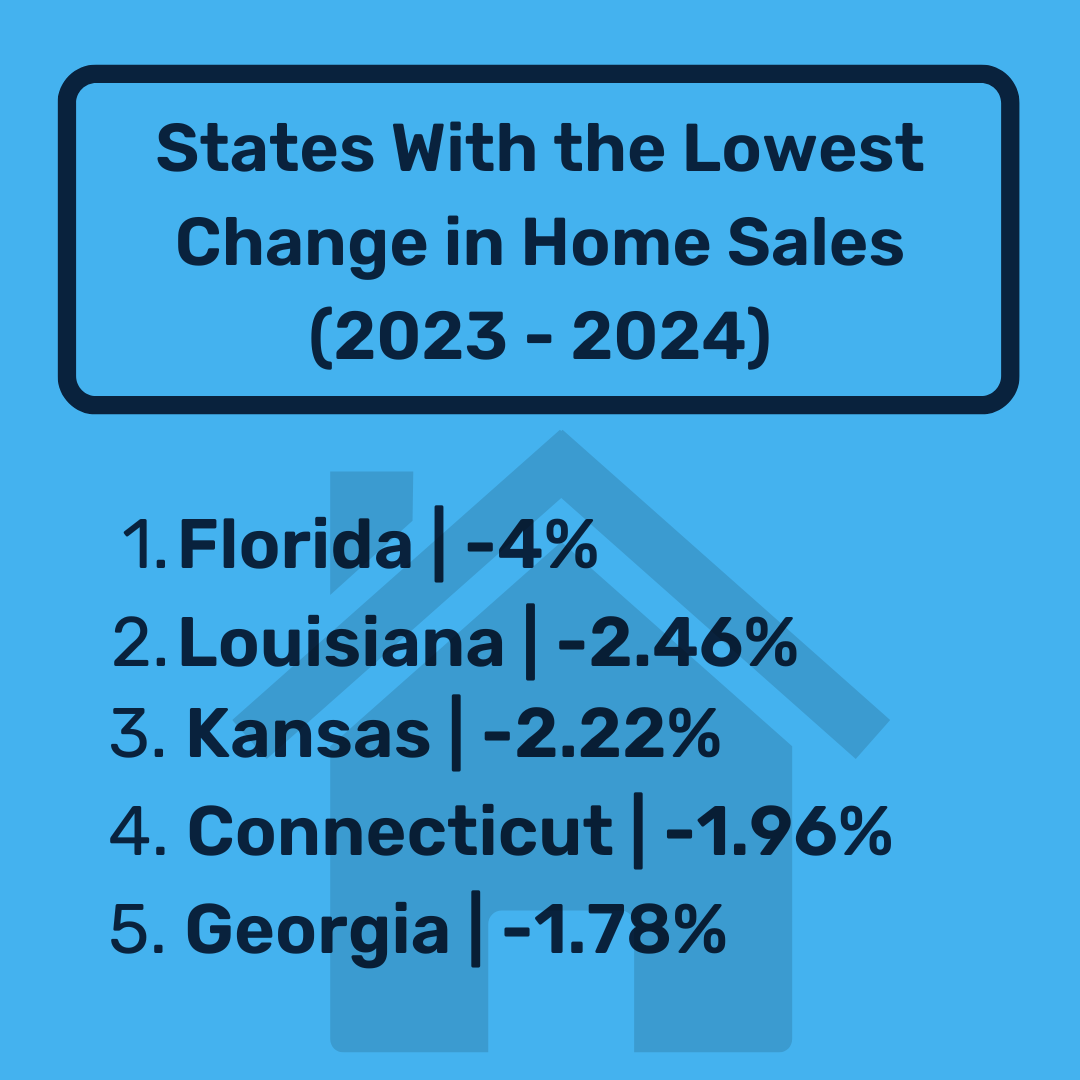
| 3 | Louisiana | 69 | 3.9 | $245,000 | $58,229 | -2.46% |
| 4 | South Carolina | 68 | 3.9 | $378,000 | $67,804 | 1.18% |
| 5 | South Dakota | 65 | 3.9 | $320,000 | $71,810 | 5.46% |
| 6 | Florida | 61 | 5.2 | $412,000 | $73,311 | -4.00% |
| 7 | Tennessee | 58 | 3.8 | $385,000 | $67,631 | 0.96% |
| 8 | North Dakota | 58 | 3.2 | $279,000 | $76,525 | 5.79% |
| 9 | West Virginia | 55 | 3.1 | $251,000 | $55,948 | 11.54% |
| 10 | Arizona | 55 | 3.6 | $446,000 | $77,315 | 0.56% |
| 11 | Alabama | 55 | 3.7 | $279,000 | $62,212 | 1.70% |
| 12 | Texas | 53 | 4.2 | $347,000 | $75,780 | 0.58% |
| 13 | Vermont | 52 | 3.5 | $407,000 | $81,211 | 3.94% |
| 14 | Wyoming | 50 | 3.6 | $425,000 | $72,415 | 5.90% |
| 15 | New Mexico | 49 | 4.0 | $353,000 | $62,268 | -0.72% |
| 16 | Wisconsin | 49 | 2.6 | $312,000 | $74,631 | 4.86% |
| 17 | Idaho | 48 | 3.1 | $478,000 | $74,942 | 3.16% |
| 18 | Illinois | 48 | 2.6 | $290,000 | $80,306 | -1.00% |
| 19 | Nevada | 46 | 3.0 | $457,000 | $76,364 | 5.13% |
| 20 | Arkansas | 46 | 3.4 | $255,000 | $58,700 | 3.94% |
| 21 | Mississippi | 46 | 3.9 | $253,000 | $54,203 | 1.29% |
| 22 | Georgia | 45 | 3.5 | $373,000 | $74,632 | -1.78% |
| 23 | Utah | 45 | 3.3 | $547,000 | $93,421 | 8.00% |
| 24 | North Carolina | 43 | 3.0 | $376,000 | $70,804 | -0.14% |
| 25 | Kentucky | 41 | 2.8 | $261,000 | $61,118 | 2.68% |
| 26 | Colorado | 39 | 3.5 | $608,000 | $92,911 | 1.31% |
| 27 | Oklahoma | 39 | 3.4 | $244,000 | $62,138 | 0.96% |
| 28 | New York | 39 | 3.2 | $537,000 | $82,095 | -1.61% |
| 29 | Oregon | 38 | 3.1 | $507,000 | $80,160 | 4.53% |
| 30 | Maine | 38 | 2.7 | $403,000 | $73,733 | 4.56% |
| 31 | Iowa | 37 | 2.7 | $235,000 | $71,433 | 1.91% |
| 32 | Connecticut | 37 | 2.1 | $424,000 | $91,665 | -1.96% |
| 33 | New Hampshire | 37 | 2.2 | $485,000 | $96,838 | 4.22% |
| 34 | Ohio | 37 | 2.2 | $246,000 | $67,769 | 0.88% |
| 35 | New Jersey | 37 | 2.4 | $525,000 | $99,781 | -1.06% |
| 36 | California | 34 | 2.7 | $820,000 | $95,521 | 5.46% |
| 37 | Pennsylvania | 33 | 2.4 | $291,000 | $73,824 | 1.16% |
| 38 | Minnesota | 32 | 2.3 | $349,000 | $85,086 | 2.03% |
| 39 | Missouri | 31 | 1.9 | $262,000 | $68,545 | 2.24% |
| 40 | Maryland | 30 | 2.0 | $429,000 | $98,678 | 1.96% |
| 41 | Virginia | 29 | 1.9 | $446,000 | $89,931 | 3.00% |
| 42 | Delaware | 29 | 2.0 | $350,000 | $81,361 | -0.25% |
| 43 | Michigan | 29 | 2.2 | $259,000 | $69,183 | -1.02% |
| 44 | Rhode Island | 28 | 1.8 | $492,000 | $84,972 | 3.81% |
| 45 | Indiana | 28 | 2.1 | $258,000 | $69,477 | 2.25% |
| 46 | Kansas | 27 | 1.5 | $275,000 | $70,333 | -2.22% |
| 47 | Alaska | 26 | 2.4 | $380,000 | $86,631 | 1.07% |
| 48 | Washington | 25 | 2.1 | $636,000 | $94,605 | 5.96% |
| 49 | Nebraska | 24 | 2.0 | $289,000 | $74,590 | 2.65% |
| 50 | Massachusetts | 22 | 1.9 | $629,000 | $99,858 | 2.57% |
| *The number of months it would take to sell all the housing inventory in the state at the current rate of sale. | ||||||
Top 10 Slowest-Selling States
In the aftermath of the pandemic, housing inventory dried up across the country, causing fierce competition that sent prices soaring. The conditions seemed to permeate real estate markets everywhere.
However, what’s happening at the national level may no longer resemble what’s occurring in local markets. Real estate has once again become highly localized, with some cities experiencing high demand and others experiencing a slowdown.
That makes it difficult to gauge how fast or slow a home will sell at the state level, but there remains a strong correlation between housing inventory and the speed of sales.
Of the 10 states with the slowest-selling real estate markets, all have a surplus of housing inventory that is greater than the national median of 2.8 months. Consequently, homes in those 10 states sit on the market a median of 63 days, compared to 40 days nationwide.
The 10 states with the slowest-selling real estate markets are:
1. Hawaii: Hawaii is no paradise for home sellers. With 5.6 months of housing supply — twice the national amount — homes tend to linger on the market. In fact, homes sit on the market for a median of 80 days, which is, once again, double the 40 days it takes to sell a home at the national level. Although the archipelago is a dream vacation destination, it appears many Americans are hesitant to settle there permanently. The number of home sales in Hawaii decreased by 0.58% from 2023 to 2024.
2. Montana: The No. 2 slowest-selling state also ranks second for most housing inventory and most days on market. With 5.2 months of housing supply, Montana homes sit on the market for a median of 78 days before selling. The median home price of $521,000 in Montana costs 22% more than the typical U.S. home, which may hinder quick sales. That’s especially true when local residents make below the median U.S. salary of $77,719. Still, home sales in Montana grew 3.67% from 2023 to 2024, perhaps buoyed by affluent buyers from wealthier states nearby.
3. Louisiana: Despite a median home price of $245,000 — about half the median U.S. price of $428,000 — home sales in Louisiana are still declining at one of the fastest rates in the country. From 2023 to 2024, home sales fell by 2.46%, marking the second-largest drop among all 50 states. Sluggish market conditions have led to a surplus of housing inventory that would take 3.9 months to sell, causing homes to sit on the market for about 69 days.
4. South Carolina: The South Carolina real estate market appears to be one in transition, with some areas experiencing a boost in sales, while others continue to struggle with weak demand. Sales activity improved across the state, growing 1.18% from 2023 to 2024. However, home supply remains elevated. South Carolina has 3.9 months of inventory, compared to 2.8 months nationwide. Homes also sit on the market longer in the Palmetto State — taking a median of 68 days to sell, compared to 40 days nationwide.
5. South Dakota: South Dakota’s housing market has grown substantially in recent years, with the number of home sales increasing by 5.46% from 2023 to 2024. Yet the growth has yet to make a significant dent in the state’s housing market. South Dakota still has 3.9 months of housing supply, while the typical state has just 2.8 months. In addition, homes spend about 65 days on the market before selling — the fifth-longest duration among all 50 states.
6. Florida: Recent storms may have spooked potential buyers, with home sales plummeting 4% from 2023 to 2024 — the largest drop among all 50 states. Weak demand has allowed homes to pile up, with the state accumulating about 5.2 months of housing supply — the second-most among all 50 states. As a result, homes spend a median of 61 days on the market before selling, compared to 40 days nationwide.
7. Tennessee: Despite a median home price of $385,000 — 10% lower than the national median of $428,000 — home sales in Tennessee continue to take longer than in other states. Homes sit on the market for about 58 days, and it would take 3.8 months to sell all the available inventory in the state. These conditions may not be indicative of all markets in the state, but they do extend to Tennessee’s most famous city, Nashville, which ranks as the sixth-slowest market in the U.S.
8. North Dakota: Like its southern neighbor, North Dakota’s real estate market is growing quickly. From 2023 to 2024, the number of home sales increased 5.79% — the fifth-fastest rate among all 50 states. Although some areas may be experiencing a boom, homes tend to linger on the market across the state. The typical North Dakota home spends 58 days on the market before selling, compared to 40 days nationwide. In addition, it would take 3.2 months to sell all the available homes in the state, compared to 2.8 months across the U.S.
9. West Virginia: With a median home price of $251,000 — nearly half the median U.S. price of $428,000 — West Virginia has some of the most affordable homes in the country. But housing may still be out of reach for local residents, who earn the second-lowest median household income at $55,948. That could be why the state has 3.1 months of housing supply, compared to 2.8 nationwide. What’s more, homes spend a median of 55 days on the market before selling, compared to 40 days nationwide.
10. Arizona: With its most populous city, Phoenix, ranking as the ninth-slowest market in the country, it’s no surprise home sales across the state are also sluggish. Arizona homes take about 55 days to sell, while homes sell in about 40 days across the U.S. With homes spending more time on the market, Arizona has amassed 29% more housing inventory than the typical state. Arizona has 3.6 months of supply, compared to 2.8 months across the U.S.
Top 10 Fastest-Selling States
Among the fastest-selling states, low housing inventory strongly correlates with quick sales — just like high inventory results in longer sales among the slowest-selling states.
Of the 10 states with the fastest-selling real estate markets, all have inventory below the national median. It would take a median of two months to sell all the available homes in those states, compared to 2.8 months nationwide.
The limited inventory contributes to swifter sales, with homes in the 10 fastest-selling states spending a median of just 28 days on the market, compared to 40 days across the U.S.
The 10 states with the fastest-selling real estate markets are:
1. Massachusetts: Sellers still have the advantage in Massachusetts, with the median home spending just 22 days on the market — the fewest among all 50 states. That’s led to a lack of inventory that would last just 1.9 months. The shortage of homes has kept prices high at $629,000, which is the fourth-highest price among all 50 states. Yet with the top annual salary of $99,858, Massachusetts residents have the purchasing power to drive swift sales even in an expensive market. In fact, home sales in the state increased 2.57% from 2023 to 2024. Its capital city, Boston, is a powerhouse market within the state, ranking as the sixth fastest-selling city in the U.S.
2. Nebraska: Nebraska jumps to the No. 2 spot in our ranking with fast sales and low inventory driving demand. Homes in the Cornhusker State spend a median of just 24 days on the market, which is the second-fastest pace in the U.S. With buyers scooping up properties so quickly, the state has just two months of housing supply, while the typical state has 2.8 months. It’s no surprise, then, that the Nebraska housing market experienced a 2.65% increase in home sales from 2023 to 2024.
3. Washington: Although the median home in Washington costs $636,000 — the third-highest price among all 50 states — that hasn’t slowed the rapid pace of home sales in the Evergreen State. From 2023 to 2024, the number of homes sold in Washington increased by 5.96%, which is the third-highest rate among all 50 states. Today, the median home sits on the market for just 25 days, and all the available homes would sell in just 2.1 months. For comparison, homes in the typical state sit on the market for 40 days, and it would take 2.8 months to sell all the available inventory.
4. Alaska: Alaska may not seem like a thriving real estate market, but home sales have grown steadily by 1.07% from 2023 to 2024. Alaska homes tend to spend fewer days on the market, selling in a median of just 26 days, compared to 40 days nationwide. These quick sales are attributed to low inventory in America’s largest state, which has just 2.4 months of housing supply, compared to 2.8 months in the typical state.
5. Kansas: While the typical U.S. state has 2.8 months of housing supply, Kansas has just 1.5 months. That’s the lowest amount among all 50 states. The lack of inventory prompts buyers to act quickly, with homes spending about 27 days on the market before selling. For comparison, it takes about 40 days to sell a home in the typical U.S. state.
6. Indiana: Indianapolis — the seventh fastest-selling city in the country — attracts buyers with its affordable homes. The rest of the state is no different. Homes in Indiana cost $258,000 — about 40% less than the median U.S. price of $428,000. This affordable locale is a beacon to buyers, with homes selling in a median of 28 days, compared to 40 days across the U.S. To sell all the available homes in the state, it would take just 2.1 months, compared to 2.8 months in the typical state.
7. Rhode Island: Rhode Island may be the smallest state in the U.S., but big things are happening in its real estate market. From 2023 to 2024, home sales increased by 3.81% — a percentage that’s 3.5x faster than the national rate. This growth has led to a decrease in supply, with the state possessing just 1.8 months of housing inventory. That’s the second-lowest amount among all 50 states. Buyers interested in purchasing a home in Rhode Island will have to act quickly, with typical homes spending just 28 days on the market, compared to 40 days nationwide.
8. Michigan: Michigan is known for its cold and snowy weather, but its real estate market is still heating up. Buyers may sweat it trying to find a home, with properties spending a median of just 29 days on the market, compared to 40 days nationwide. A shortage of homes in the state is causing rapid sales. Michigan has just 2.2 months of housing supply, while the typical state has 2.8 months.
9. Delaware: Competitive salaries combined with affordable home prices drive demand in this small Mid-Atlantic market. Delaware residents earn a median annual salary of $81,361 — 5% more than the typical American — making them well equipped to buy homes that cost 18% less than the national median at $350,000. Thanks to their strong purchasing power, the median Delaware home spends just 29 days on the market, compared to 40 days nationwide. It’s no wonder the state has just two months of inventory — the fourth-lowest amount among all 50 states.
10. Virginia: With its capital city, Richmond, ranking as the fifth fastest-selling market in the county, it’s no surprise the state has other strong markets that propel it into the top 10. Overall, home sales grew 3% from 2023 to 2024. Increasing demand for homes has reduced the housing supply, with the state possessing just 1.9 months of inventory — the third-lowest amount among all 50 states. As a result, typical properties tend to sell quickly after just 29 days on the market, compared to 40 days nationwide.
Rankings by Category
 |
 |
 |
 |
 |
 |
 |
 |
 |
 |
 |
 |
Methodology
In preparing this study, Clever evaluated data sources from Redfin, the Bureau of Labor Statistics, Zillow, the U.S. Census, and the American Community Survey. In addition, Clever conducted interviews with real estate agents across the country to get direct insights into the labor markets in their area.
About Clever
Since 2017, Clever Real Estate has been on a mission to make selling or buying a home easier and more affordable for everyone. 12 million annual readers rely on Clever’s library of educational content and data-driven research to make smarter real estate decisions—and to date, Clever has helped consumers save more than $180 million on realtor fees. Clever’s research has been featured in The New York Times, Business Insider, Inman, Housing Wire, and many more.
More Research From Clever


Articles You May Like


FAQs
Where can I sell my house the fastest?
Homes sell the fastest in Grand Rapids, Michigan, which has the least amount of housing inventory among all cities studied at 1.3 months. Buyers must act quickly, as homes are typically purchased within 13 days of being listed. Learn more.
How long does it take to sell a house?
In the typical U.S. city, a home sits on the market for about 37 days. However, it can take longer or shorter depending on where you live. In Miami, homes sit on the market a median of 69 days. In Grand Rapids, Michigan, homes sell in about 13 days of being listed. Learn more.
Why do some houses stay on the market so long?
There is a strong correlation between the amount of inventory and the speed of sales. In the typical U.S. city, it would take 2.8 months to sell all the available homes. But home sales in the top 10 slowest-selling markets take longer, with supply lasting a median 3.5 months. Learn more.
The post 2025 Data: U.S. Cities and States Where It Takes the Longest to Sell a Home appeared first on Clever Real Estate.