Stock Market Outlook entering the Week of May 4th = Uptrend
- ADX Directional Indicators: Neutral
- Institutional Activity (Price & Volume): Uptrend
- On Balance Volume Indicator: Uptrend
ANALYSIS
The stock market outlook shifted back to an uptrend last Monday, as buying pressure flooded into equities. Along with the market, many sectors also shifted to a bullish bias.
The S&P500 ( $SPX ) rose 2.9% last week. The index sits ~2% above the 50-day moving average and ~1% below the 200-day moving average.

SPX Price & Volume Chart for May 04 2025
Institutional activity remains in an uptrend; below average trading volume remains a concern. On-Balance volume ( OBV ), which was on the verge of shifted coming into last week, confirmed its signal Monday and moved the overall outlook back to an uptrend. The Direction Indicator ( ADX ) shifted to neutral on Friday.

S&P Sector Performance for Week 19 of 2025
Industrials ( $XLI ) led the way last week, rising more than 4%. Energy ( $XLE ) was the only sector without a gain, owing to a large drop in oil prices. Most sectors moved back to bullish bias:
- Communications ( $XLC )
- Consumer Discretionary ( $XLY )
- Consumer Staples ( $XLP )
- Financials ( $XLF )
- Industrials ( $XLI )
- Materials ( $XLB )
- Real Estate ( $XLRE )
- Technology ( $XLK )

Sector Style Performance for Week 19 of 2025
All style funds ended the week with gains; Momentum ( $MTUM ) was the highest and High Dividend ( $SPHD ) was the lowest. Most styles returned to bullish bias as well, though small and mid-cap value are still working through their recent losses.

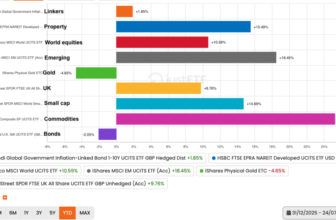
Asset Class Performance for Week 19 2025
No surprise here; U.S. equities ( $SPY ) led the way higher last week. Oil ( $USO ) collapsed on headlines that OPEC+ agreed to boost output in June. Bonds ( $IEF ) continued to waffle, falling back to neutral bias on the stronger-than-expected jobs data.
COMMENTARY
After an impressive stretch of higher closes, a majority of equity sectors and styles show bullish bias now. The break above the 50-day moving average and 5600 was important; now the index needs to deal with the 200-day and the 5800 resistance level.
Actually, any pullback or consolidation would be the ideal time to deploy capital, giving equities time to cool off, since they’re currently overbought. Use the watchlists you’ve been updating and look for stocks breaking out out of consolidation phases and price patterns with higher volume. And if you do deploy capital, keep those losses small if the trade turns against you.
Despite the bullishness of equities, the macroeconomic picture remains murky at best.
April Non-Farm Payrolls (NFP) data was slightly lower than March, but well above expectations despite uncertainty from all the tariff announcements.
PCE continues to be a challenge for tea-leaf readers: March inflation was inline with expectations, but February data was revised significantly higher (Headline up 20 bps from 2.5% to 2.7% and Core up 30 bps from 2.7% to 3%). Given recent trends, it’s reasonable to assume March inflation data is higher than reported and will be revised next month.
| PCE (y/y) | Actual | Prior |
Expected |
| Headline | +2.3% | +2.7%* | +2.2% |
| Core | +2.6% | +3.0%* | +2.6% |
The advanced Q1 GDP came in at -0.3%, down from +1.6% in 2024 Q1 and below estimates for +0.3%. A 41.3% surge in imports did the most damage, as businesses stockpiled goods in an attempt to mitigate higher costs from tariffs. Consumer spending and federal government expenditures were also lower.
We need another month or two before seeing the full effect of Liberation Day announcements, as inventories, supply chains, and shipping normalize. And that data won’t include any adjustments, or lack thereof, to tariff policies that occur in the interim.
Four of the “Magnificent 7” reported better than expected earnings, but guidance was mixed:
- Meta reported higher revenue & earnings, and gave positive guidance
- Microsoft reported higher revenue & earnings, and gave positive guidance
- Apple reported higher revenue & earnings, and gave lukewarm guidance
- Amazon’s reported higher revenue & earnings, and gave weak guidance
This week we get more earnings and a FOMC interest rate decision. The committee likely keeps interest rates unchanged, since inflation and labor data show a “neutral” picture and imports clouded Q1 economic figures.
Best to Your Week!
P.S. If you find this research helpful, please tell a friend.
If you don’t, tell an enemy.