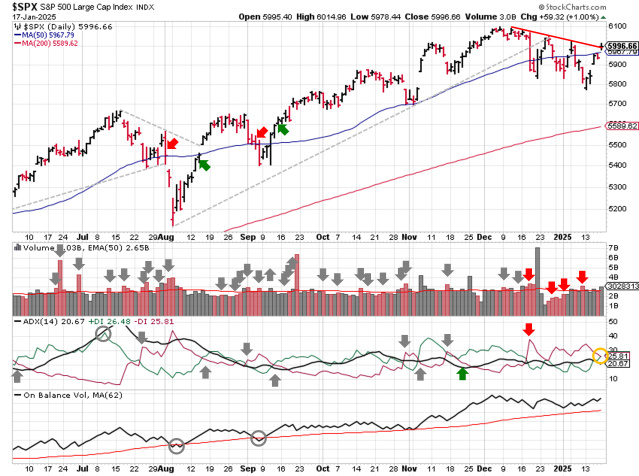
Stock Market Outlook entering the Week of January 19th= Uptrend
- ADX Directional Indicators: Neutral
- Institutional Activity (Price & Volume): Uptrend
- On Balance Volume Indicator: Uptrend
ANALYSIS
The stock market outlook shifts back to an uptrend, after bouncing from oversold levels into a long weekend.
The S&P500 ( $SPX ) gained 2.9% last week. The index is 0.5% above the 50-day moving average and ~7% above the 200-day moving average.

SPX Price & Volume Chart for Jan 19 2025
The ADX is neutral, and will flip to bullish with another day of gains. Institutional activity improved last week and shifted back to bullish, with signs of accumulation and a close above the 50-day moving average. On-Balance Volume also shows a rate-of-change increase.

S&P Sector Performance for Week 03 of 2025
Energy ( $XLE ) and Financials ( $XLF ) put in quite a week, as did Materials ( $XLB ). Consumer Staples ( $XLP ) was the weakest section, only managing a gain of 1.2%. Several sectors mirrored the indexes shift back to a bullish bias: Communications, Energy, Financials, and Utilities. Technology and Industrials improved to neutral.

Sector Style Performance for Week 03 of 2025
The Momentum style factor was last week’s top performer, gaining 5%. The “worst” performer was Large Cap Growth at +2.2%.
Much like the index sectors, style factors also showed an improvement in bias: High Beta, Mid, Large, and Mega-Cap growth, Mid-Cap value and Momentum all shifted to bullish, while Quality moved back to neutral.

Asset Class Performance for Week 03 2025
Bitcoin ( $IBIT ) was the best performer last week, and is almost back to even over the past 4 weeks. The U.S. dollar was the worst performer. U.S. equities flipped from Bearish to Bullish bias, confirming the change in the market outlook.
COMMENTARY
Last week’s post touched on the quick turnaround we’ve seen in recent downtrends. You have to go back to August-October 2023 to find one lasting longer than 4 weeks. Of course, there’s no guarantee the market doesn’t pullback again from here and flip to a downtrend again. The incoming Trump administration promised many executive orders on Day 1, and we need to see how buyers and sellers react to the details.
One trade-off of mechanical investing/trading systems is the whipsaw; when price movement generates successive entry and exit signals during a short period of time. For example, a 50-day moving average cross-over signal would have tripped 6 times since mid-December; that’s about once per week. The example process presented here, in the weekend update, uses 3 indicators to reduce the number of false signals, but no system is perfect. It’s the “price” you pay for avoiding major drawdowns.
The whipsaw is another reason to evaluate the relative performance of your holdings and weather the storm with tickers showing strength during general market weakness ( drop the zeros; stick with the heroes ). For example, rising oil and natural gas prices have supported the Energy sector, which is up almost 8% over the past 4 weeks, despite the general weakness in equities ( $SPY dropped 1.5% ). On the flip side, Consumer Staples fell ~6% over the same period.
Speaking of the price you pay, December inflation data showed rising prices remain an issue for the U.S. economy. The headline consumer price index (CPI) rose for the third month in a row, although Core CPI fell 10 basis points and has been basically flat since July.
| CPI (y/y) | Actual | Prior |
Expected |
| Headline | +2.9% | +2.7% | +2.9% |
| Core | +3.2% | +3.3% | +3.3% |
Producer prices (PPI) rose in November for the 3rd month in a row. Core PPI was flat for the second month in a row, but again because the prior month’s reading was revised higher (up from 3.4%).
| PPI (y/y) | Actual | Prior |
Expected |
| Headline | +3.3% | +3.0% | +3.4% |
| Core | +3.5% | +3.5%* | +3.8% |
Retails sales rose 0.4% in December, slowing significantly from than November’s 0.8% increase and below expectations of 0.6%.
U.S. markets are closed Monday, on observance of Rev. Martin Luther King Jr.’s birthday, and then earnings season begins to ramp up over the remainder of the week.
Best to Your Week!
P.S. If you find this research helpful, please tell a friend.
If you don’t, tell an enemy.

