The blog is about Pearson correlation theory, properties, formulas of calculation, testing of correlation, solved example and step by step guide to perform correlation in Agri Analyze tool. Quiz of correlation is also shared (Reading time 12 mins)
Correlation refers to a statistical measure that describes the extent to which two variables change together. It is the degree of linear relationship between two continuous variables in a bivariate distribution. It is a way to quantify the degree to which two variables are related.
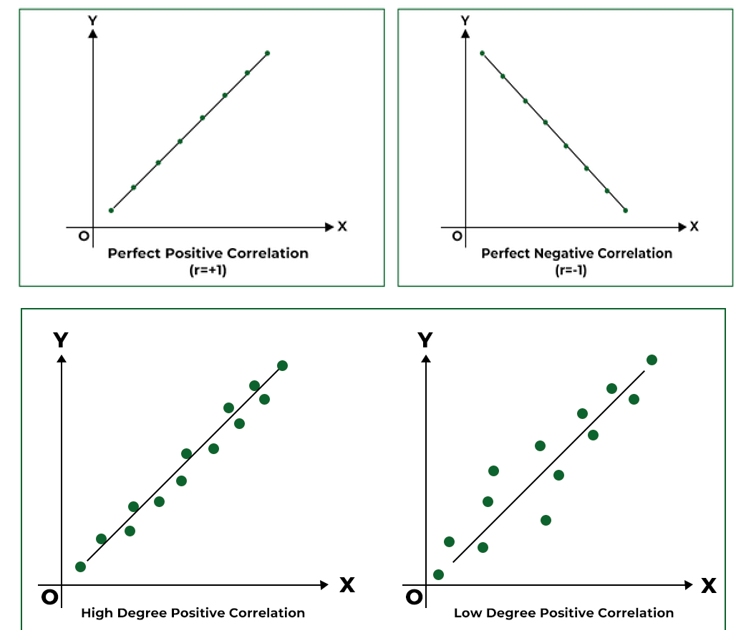
Correlation can be positive (both variables increase or decrease together), negative (one variable increases while the other decreases), or zero (no relationship between the variables). The correlation coefficient, typically denoted as r and it ranges from -1 to 1:
Where, r = 1 indicates perfect positive correlation
r = -1 indicates perfect negative correlation
r = 0 indicates no correlation
Properties of correlation coefficient:
1) The value of correlation always ranges between -1 to +1.
2) Correlation is independent of change in origin and scale.
3) Correlation is unit free.
4) In case of two variable frame work correlation coefficient is geometric mean of two regression coefficient.
Visualizing relationship using scatter diagram:
In correlation problems, first we
have to investigate whether there is any relation between the variables, say, X
and Y. For this purpose, we use scatter diagram.
From the scatter diagram, it is
possible to determine the presence of correlation between X and Y as well as
its nature whether it is positive or negative and whether it is linear or
curvilinear. In the figure, diagrams a, b and c illustrate positive
correlation, negative correlation and no correlation, respectively. When the
trend is linear, as shown in diagrams a and b, the relationship between X and Y
is referred to as linear correlation. Conversely, when the trend is
curvilinear, as shown in diagram d, the relationship is termed curvilinear or
non-linear correlation. This non-linear relationship can take various forms,
such as quadratic, cubic, etc. Below are the scatter diagrams for the different relationships of the variables.


Pearson correlation:
The scatter diagram will give only a
vague idea about the presence or absence of correlation and the nature
(positive or negative) of correlation. It will not indicate about the strength
or degree of relationship between two variables. The index of the degree of
relationship between two continuous variables is known as correlation
coefficient. The correlation coefficient is symbolized as r in case of a sample
and as ‘rho’ in case of population. The
correlation coefficient, r is known as Pearson’s Correlation coefficient, since
it was developed by Karl Pearson. It is often referred to as Product-moment
correlation in order to distinguish it from other measures of
inter-relationship.

The numerator is termed as the sum of products of X and Y and abbreviated as SP (XY). In the denominator, the first term is called the sum of squares of X or SS(X) and the second term is called the sum of squares of Y or SS(Y). The above simplified formula is used for computational purposes.
The denominator in the above formula is always positive. The numerator may be positive or negative, making r to be either positive or negative.
The correlation coefficient r is used under certain assumptions:
- The variables under study are continuous random variables and they are normally distributed
- The relationship between the variables is linear
- Each pair of observation is unconnected with other pairs
Testing the Significance of the Correlation Coefficient: A Step-by-Step Guide
To test the significance of the correlation coefficient, typically perform a hypothesis test to determine whether the observed correlation is statistically significant. The steps for testing the significance of the correlation coefficient r are as follows:

Solved example of Pearson Correlation
Problem statement: There are two variables X and Y each having 5 observations. Compute the Pearson correlation and also test its significance using t test. The data is shared below
X: 10, 20, 30, 40, 50 and Y: 20, 25, 15, 35, 30


Steps to perform Pearson Correlation Analysis using Agri Analyze
A more complex data for 4 variables is considered with 150 observations was considered for demonstration. The snap is given below:

Link of the data set
Step1: Go with Agri Analyze
site. Direct link
Step2: Click on ANALYTICAL TOOL followed by CORRELATION AND REGRESSION ANALYSIS followed by PEARSON CORRELATION

Step4: Click on the download
Output Report:
The output will have three components 1) Heatmap 2) Correlation with p values 3) Interpretation report
1) Heatmap

2) Correlation Matrix

3) Smart interpretation

Additional Link
This blog is written by