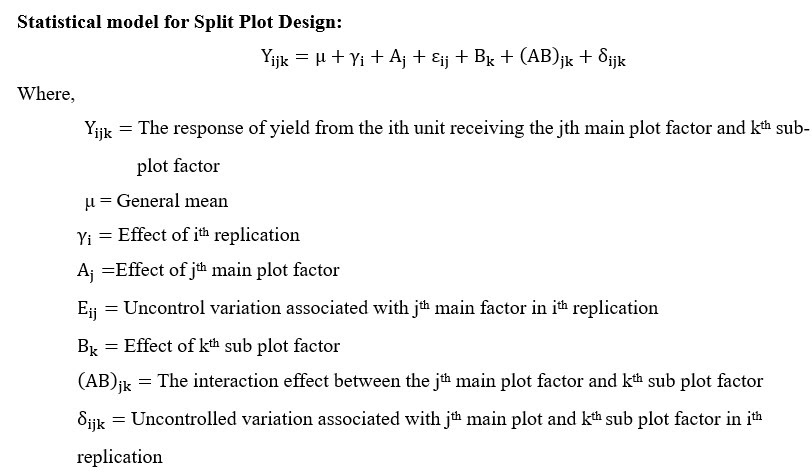
This blog is about Split plot design, randomization, ANOVA, solved example with steps and demonstration of split plot analysis in Agri Analyze platform. Quiz on split plot design is given below (Reading time 15min)
The split-plot design is commonly employed in
factorial experiments. This design can integrate various other designs, such as
completely randomized designs (CRD) and randomized complete block designs
(RCBD). The fundamental principle involves dividing whole plots or whole units,
to which levels of one or more factors are applied (main plots). These main-plots are then subjected to levels of one or more
additional factors called sub plot. Consequently, each whole unit functions as a block for the
treatments applied to the sub-units.
In a
split-plot design, the precision in estimating the main plot factor’s effect is
reduced to enhance the precision of the sub-plot factor’s effect. This design
allows for more accurate measurement of the sub-plot factor’s main effect and
its interaction with the main plot factor compared to a randomized block
design. However, the precision in measuring the main plot treatments (i.e.,
the levels of the main plot factor) is less than that achieved with RCBD.
Ideal applications of this design
A split-plot design
is particularly advantageous when treatments associated with one or more
factors necessitate larger experimental units than treatments for other
factors. For instance, in a field experiment, factors such as methods of land
preparation or irrigation application typically require large plots or
experimental units. In contrast, another factor, like crop varieties, can be
evaluated using smaller plots. The split-plot design ensures efficient resource
utilization and enhances the precision of certain factor measurements, making
it ideal for complex experimental setups with hierarchical treatment
structures.
1. The
split-plot design is also beneficial when incorporating an additional factor to
broaden the scope of an experiment. For example, if the primary goal is to
compare the effectiveness of various fungicides in protecting against disease
infection, the experiment’s scope can be expanded by including several crop
varieties known to differ in disease resistance. In this setup, the varieties
can be arranged in whole units, while the fungicide treatments (seed
protectants) are applied to sub-units. This approach allows for a comprehensive
analysis of both fungicide efficacy and varietal resistance within a single
experimental framework, optimizing resource use and experimental precision.
Randomization and layout strategies for split-plot
experiments
In a split-plot design, there are
distinct randomization procedures for the main plots and sub-plots. Within each
replication, main plot treatments are initially randomly allocated to the main
plots. Subsequently, sub-plot treatments are randomly assigned within each main
plot. This sequential randomization ensures independent and controlled
assignment of treatments at both the main plot and sub-plot levels, maintaining
the integrity and statistical validity of the experimental design.
Step 1: Partition the
experimental area into “r” replications, each subdivided into
“a” main plots.
Step
2: Randomly
assign the treatment levels to the main plots within each replication
independently.
Step
3: Partition
each replication into “a” main plots, and within each main plot,
partition into ‘b’ sub-plots. Randomly assign the levels of the sub-plot
factors within each sub-plot.

Advantage of
split plot design:
In a split-plot design, the effects of sub-plot
treatments and their interactions with main plot treatments are tested with
greater precision than the effects of the main plot treatments.
This design is more convenient for handling
agricultural operations. When treatments such as irrigation, tillage, sowing
dates, and other cultural practices are involved, these treatments can be
assigned to the main plots.
Due to the combination of factors within the same
experiment, this design incurs very little extra cost. Conducting separate
experiments for each factor would be more expensive.
It saves experimental area and resources by
devoting them only to the border rows in the main plot.
Disadvantage of split plot design
1. We lose precision for main plot treatments but gain
precision for sub-plot treatments.
With the limitation of experimental area, the
degrees of freedom for error often do not meet the minimum requirement of 12.
When missing plots occur, the analysis becomes more
complicated.


EXAMPLE FOR SPLIT PLOT DESIGN
A split-plot
design was used to investigate the effects of irrigation levels (main plot
factor) and fertilizer types (sub-plot factor) on the yield of a particular
crop. The experiment was conducted over four replicates (R1, R2, R3, R4).
Main Plot Factor (A – Irrigation Levels):
A1: Low Irrigation
A2: Medium Irrigation
A3: High Irrigation
Sub-Plot Factor (B – Fertilizer Types):
B1: Organic Fertilizer
B2: Inorganic Fertilizer
B3: Mixed Fertilizer
Data:
|
Treatments |
R1 |
R2 |
R3 |
R4 |
|
A1B1 |
386 |
396 |
298 |
387 |
|
A1B2 |
496 |
549 |
469 |
513 |
|
A1B3 |
476 |
492 |
436 |
476 |
|
A2B1 |
376 |
406 |
280 |
347 |
|
A2B2 |
480 |
540 |
436 |
500 |
|
A2B3 |
455 |
512 |
398 |
468 |
|
A3B1 |
355 |
388 |
201 |
337 |
|
A3B2 |
446 |
533 |
413 |
482 |
|
A3B3 |
433 |
482 |
334 |
435 |
Solution:
|
Treatments |
R1 |
R2 |
R3 |
R4 |
Treatment total |
Treatment means |
|
A1B1 |
386 |
396 |
298 |
387 |
1467 |
366.75 |
|
A1B2 |
496 |
549 |
469 |
513 |
2027 |
506.75 |
|
A1B3 |
476 |
492 |
436 |
476 |
1880 |
470.00 |
|
A2B1 |
376 |
406 |
280 |
347 |
1409 |
352.25 |
|
A2B2 |
480 |
540 |
436 |
500 |
1956 |
489.00 |
|
A2B3 |
455 |
512 |
398 |
468 |
1833 |
458.25 |
|
A3B1 |
355 |
388 |
201 |
337 |
1281 |
320.25 |
|
A3B2 |
446 |
533 |
413 |
482 |
1874 |
468.50 |
|
A3B3 |
433 |
482 |
334 |
435 |
1684 |
421.00 |
|
Total |
3903 |
4298 |
3265 |
3945 |
15411 |
|

A x B table:
|
|
B1 |
B2 |
B3 |
Total A |
|
A1 |
1467 |
2027 |
1880 |
5374 |
|
A2 |
1409 |
1956 |
1833 |
5198 |
|
A3 |
1281 |
1874 |
1684 |
4839 |
|
Total B |
4157 |
5857 |
5397 |
|

Main factor (A) x Replication table:
|
|
R1 |
R2 |
R3 |
R4 |
|
A1 |
1358 |
1437 |
1203 |
1376 |
|
A2 |
1311 |
1458 |
1114 |
1315 |
|
A3 |
1234 |
1403 |
948 |
1254 |

Calculation of Degrees of Freedom
Replication DF = r – 1 = 4 – 1 = 3
Main Plot DF = A – 1 = 3 – 1 = 2
Error a DF = (r-1)*(A-1) = 6
Sub Plot DF = B – 1 = 3 – 1 = 2
Interaction DF = (A-1) * (B-1) = 4
Error b DF = A*(r-1)*(B-1) = 18
Total DF = A*B*r – 1 = 35
The Mean Square for different
component is obtained by dividing SS with DF for respective component
Calculated F value for different
ANOVA components
Replication Cal F = Replication MS /
Error a MS = 28.12
Main Plot A Cal F = Main Plot A MS /
Error a MS = 8.48
Sub Plot B Cal F = Sub Plot B MS /
Error b MS = 186.61
Interaction Cal F = Interaction MS /
Error b MS = 0.22
Final ANOVA Table for Crop Yield
Analysis Using Split-Plot Design with Irrigation (Main Plot Factor) and
Fertilizer (Sub Plot Factor) Treatments:
|
SV |
DF |
SS |
MS |
CAL F |
Table F 5% |
Table F 1% |
|
Replication |
3 |
61636.97 |
20545.66 |
28.12 |
3.16 |
8.49 |
|
Main Plot A |
2 |
12391.17 |
6195.58 |
8.48 |
5.14 |
10.92 |
|
Error (a) |
6 |
4382.61 |
730.44 |
– |
– |
– |
|
Sub Plot B |
2 |
128866.67 |
64433.33 |
186.61 |
3.55 |
6.01 |
|
Interaction |
4 |
304.17 |
76.04 |
0.22 |
2.93 |
4.58 |
|
Error (b) |
18 |
6215.17 |
345.29 |
– |
– |
– |
|
Total |
35 |
213796.75 |
– |
– |
– |
– |


Conclusion:
·
The calculated F-value (28.12) is much greater than the critical
F-values at both 5% (3.16) and 1% (8.49) significance levels. Therefore,
there is strong evidence to suggest that there are significant differences
between the replicates.
·
The calculated F-value (8.48) for main factor exceeds the critical
F-value 5% (5.14) significance levels. This indicates that there are significant
differences among the irrigation level.
·
The calculated F-value (186.61) for sub factor exceeds the critical
F-value at 1% (6.01) significance level. This indicates that there is highly
significant variation among level of fertilizer.
·
The calculated F-value (0.22) for interaction between main factor and
sub factor (A x B) which is less than critical F-value at 5% (2.93)
significance level. This indicate that there is non-significant interaction
between irrigation and fertilizer.
·
For the fertilizer, highest yield was observed for B2 and none of the
level of fertilizer at par with it based on critical difference.
For
the interaction (A x B), highest yield was observed for A1 x B2 and A2 x B2 were found statistically at par with it.
Agri Analyze is the tool that helps researchers to perform analysis of design of experiments online.
Step 1: To create a CSV file with columns for replication, main factor (A), sub factor (B) and Yield. Link of the data

Step 2: Go with Agri Analyze site. https://agrianalyze.com/Default.aspx
Step 3: Click on
ANALYTICAL TOOL
Step 4: Click on DESIGN
OF EXPERIMENT
Step 5: Click on SPLIT
PLOT DESIGN ANALYSIS
Step 6: Click on SPLIT
PLOT 1,1 (SPLIT PLOT) ANALYSIS

Step 7: Select CSV file.
Step 8: Select replication, main factor (A), sub factor (B) and
dependent variable (Yield).
Step 9: Select a test for
multiple comparisons, such as the Least Significant Difference (LSD) test, to
determine significant differences among groups. Same as for Duncan’s New
Multiple Range Test (DNMRT), Tukey’s HSD Test.

Step 10: After submit
download analysis report.
Output of the Analysis


REFERENCES
Gomez, K. A., & Gomez, A. A. (1984). Statistical
Procedures for Agricultural Research. John wiley & sons. 50-67.
This Blog is written by
MSc Scholar
Department of Agricultural Statistics
Anand Agricultural University