

Summary
- Corn is due for a sharp rally, and we will likely see $8-10 per bushel between 2021-2023
- Corn has been in a deep bear market since 2013… Eight long years. Core supply and demand fundamentals are now improving.
-
Global commodity prices have started to break out of a multi-year range. Drivers include:
- the demand recovery as the pandemic moderates
- supply disruptions due to shortages, and
- fiscal stimulus injected by governments worldwide. A rising tide lifts all boats.
-
Legendary commodity investor
Jim Rogers
has often said that major commodity cycles tend to be
about every 20 years.
He predicted the last great commodities bull market that started in 1999… 1999 + 20 = 2019.
Is it time to get long-term bullish?
A Rising Tide Lifts All Boats
Commodity cycles follow the old adage “history rhymes, but it does not repeat”. We always have had commodity
cycles, and we always will. The driving factors for each cycle tend to differ.
The last corn bull market was driven in part by the
Renewable Fuel Standard
(“RFS”, also known as the ethanol
mandate) and a growing middle-class in China. Common cycle drivers in the past have included weather
fluctuations, wars, embargoes, tariffs, inflation, etc.
The current cycle’s drivers include:
- New fiscal stimulus and meaningful increase in money supply
- Labor and farmhand shortages due to travel restrictions
- Growing middle class India, Indonesia, Vietnam, Sub-Sahara Africa and other new-era emerging markets
Last week the United Nations’ Food & Agriculture Organization (FAO) released its March 2021 report.
The FAO tracks a global basket of food staples including sugar, dairy, vegetable oils, cereals and meat
— this index rose 2.4% in February, reaching its highest level since July 2014 (ninth consecutive monthly increase).
The FAO’s food index was stuck in a range of plus or minus 10% since 2015, and it began to break out
of the range starting in 4Q 2020. It is now ~20% higher than the trailing five-year range, with the
bulk of the increase occurring over the last nine months. The report had a common theme for most of the
categories: shrinking supply and growing global demand.

Source:
UN FAO
Takeaway: The FAO food price index was stuck in a range for five years, and recently it started to break out (red and yellow lines lines).
There is a modest correlation and common trend among agriculture commodities long-term, as well as broader
industrial metals and energy. During the initial onset of the pandemic commodities took a hit as markets re-calibrated
for lower growth expectations.
We saw oil prices go negative for the first time ever, and a flight to safety
and bonds. Commodities bottomed and began their strong recovery when governments around the world announced
their large fiscal stimulus plans.
The fiscal stimulus is impacting prices and demand. The transmission of this stimulus is different than prior economic recovery
measures that followed the Financial Crisis – this stimulus is cash given directly to people and businesses to spend immediately.
Money supply (as measured by the
Federal Reserve’s M3)
is 24% higher than it was prior to the stimulus. Congress is
about to pass legislation to
distribute another $1.9 trillion,
which is an additional 10% growth to the money supply.
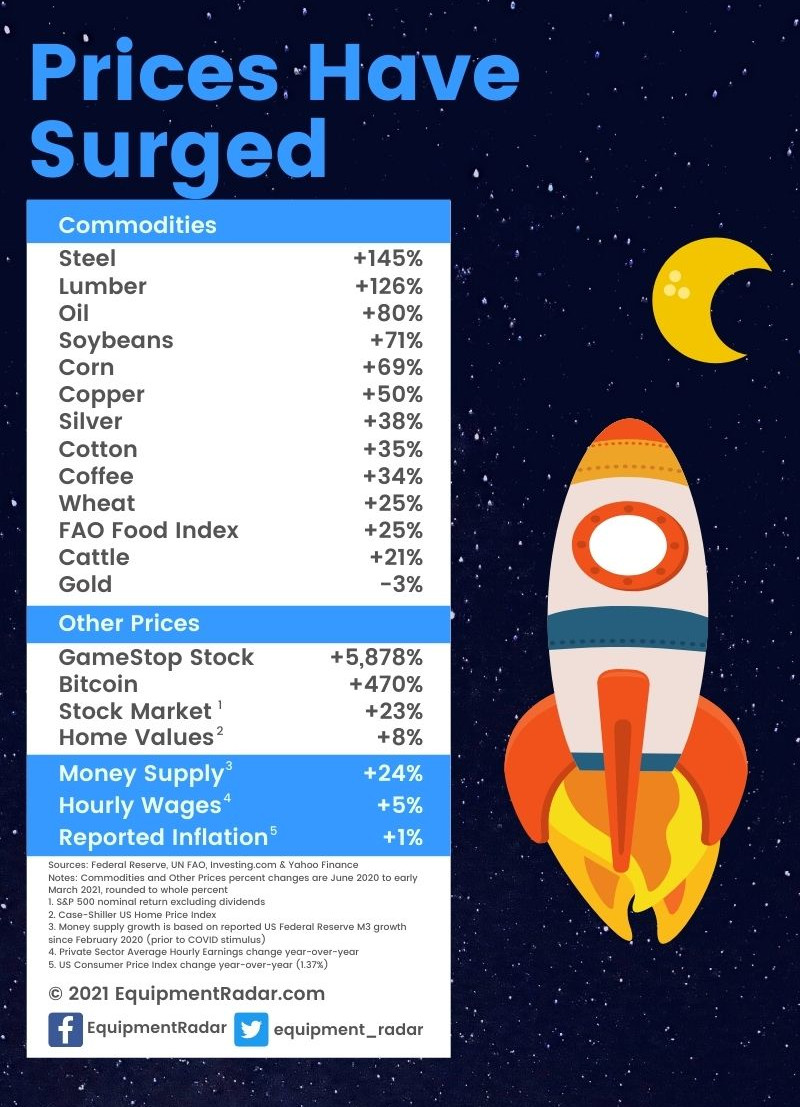
These are some big moves by historical standards. Reported consumer price inflation is +1%? Hmm… that’s a head-scratcher.
We should start to see these large price moves work their way into consumer and producer prices over coming months.
Price increases often have a 6-12 month lag given a variety of factors, including:
- many existing contractual agreements adjust pricing quarterly or annually and need time to adjust
- transit times
- “wait and see” approach by sellers to confirm the higher costs are sticky
Core Corn Fundamentals Are Improving
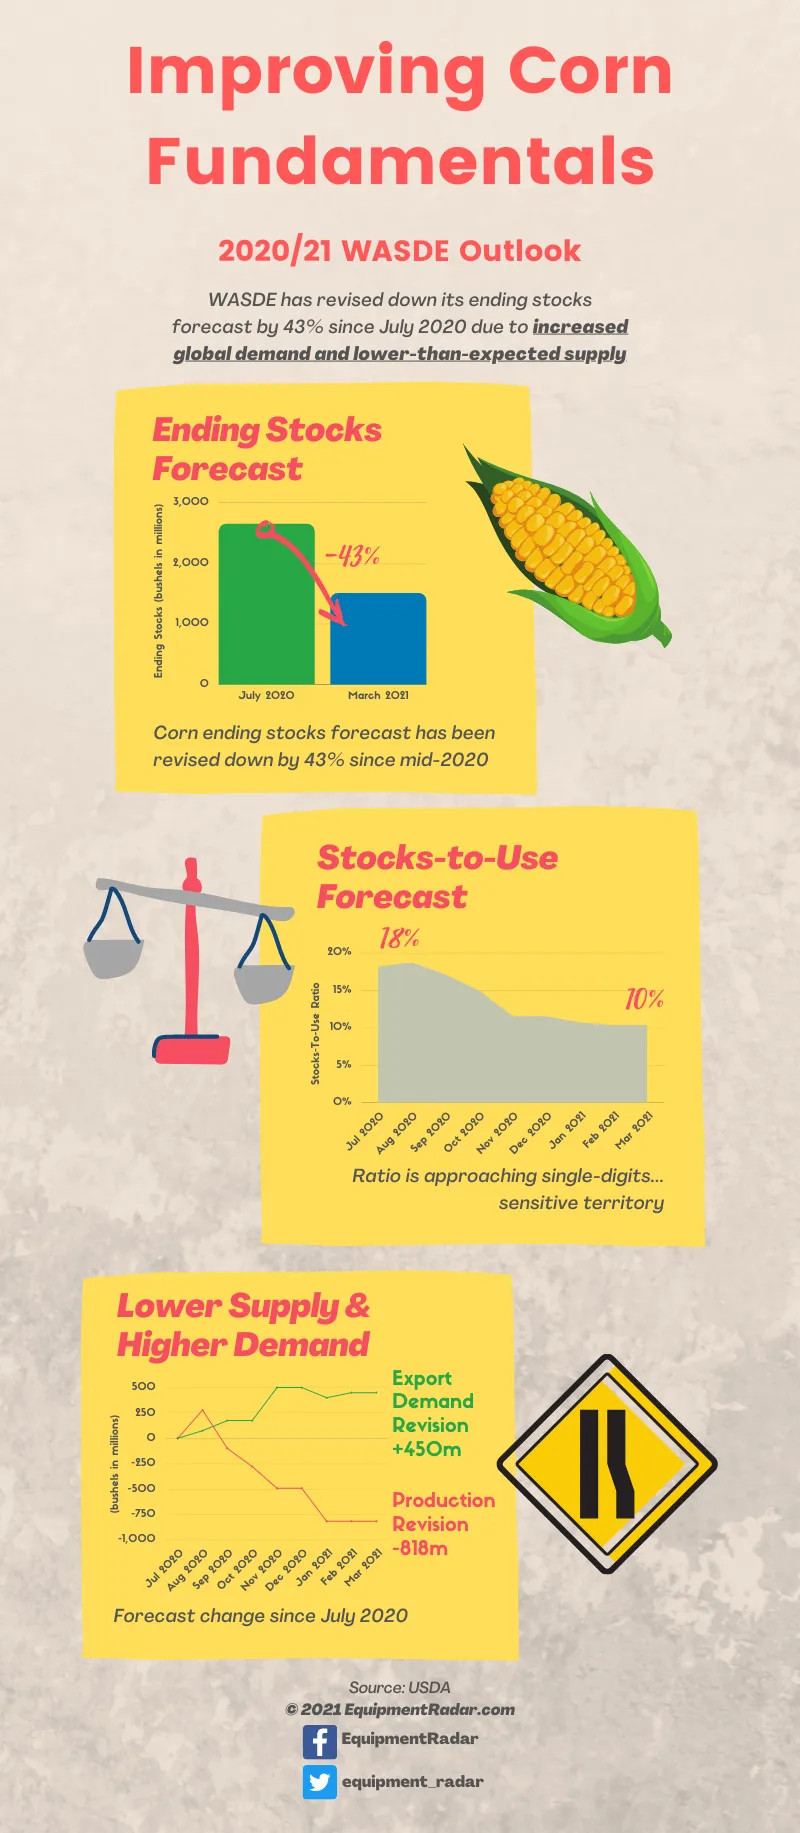
The USDA’s 2020/21 corn forecast (World Agricultural Supply and Demand Estimates, “WASDE”) has
gradually changed its tune since the initial forecast in July 2020. It now paints a picture of
a more constrained supply and demand environment than originally anticipated.
March 2021 WASDE report link
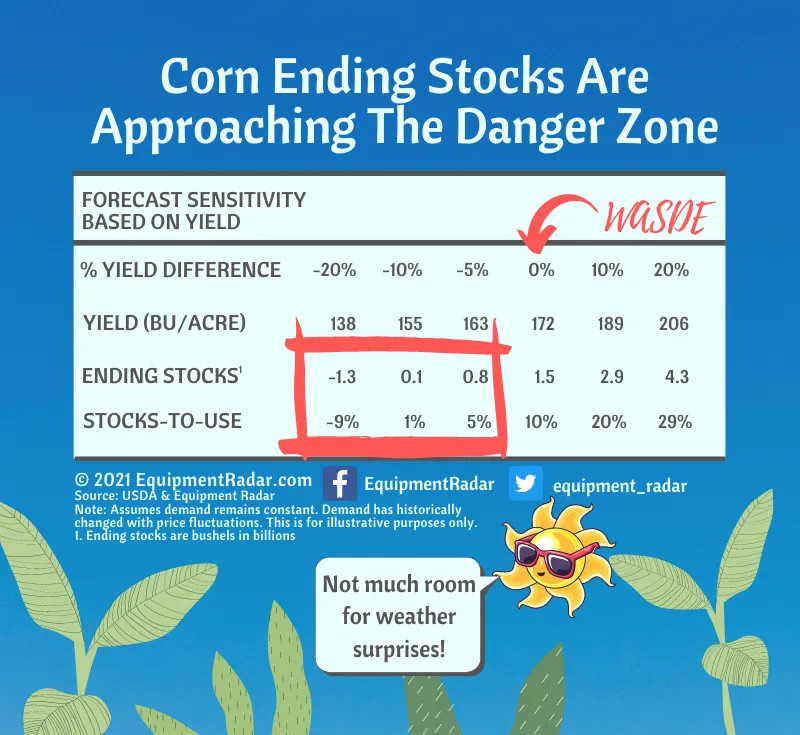
WASDE lowered its ending stocks projection by 43% to 1.5bn bu from 2.6bn bu, and ending stocks-to-use
ratio from 18% to 10%. Most of the revision is due to increased exports (0.5bn bu) and decreased
production (0.8bn bu) – offset by lower domestic feed consumption (0.2bn bu).
Prices tend to become more volatile and susceptible to sharp moves to the upside when the
stocks-to-use ratio is in the single-digit range. There is less padding for any unforeseen reductions
in yield from weather surprises.
Source:
USDA NASS
and RL Nielsen of Purdue University
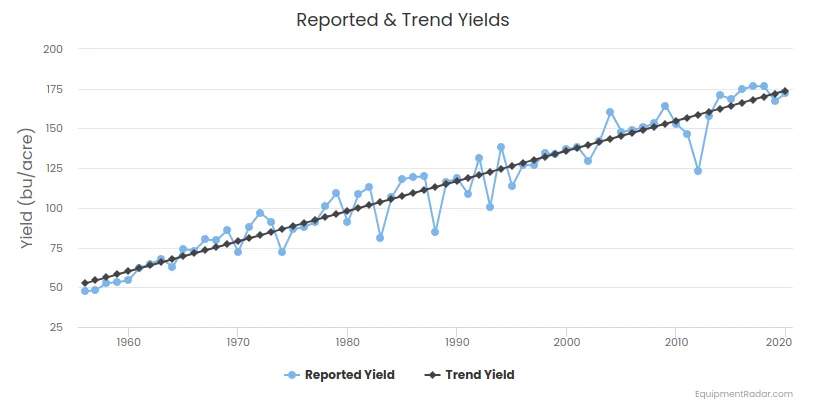
Takeaway: Over the long-term trend yield (dark line) increases, driven by technology, machinery
and seed improvements. WASDE projects 2020/21 yield of 172 bu/acre (about 2% lower than trend
yield at 176 bu/acre). WASDE began its forecast at 178.5 bu/acre in July 2020 and gradually
revised it down to 172 bu/acre.

Source:
USDA NASS
and
RL Nielsen of Purdue University
Takeaway: Reported yield tends to be volatile relative to trend yield. The chart above shows the percentage
variance of reported yield relative to the expected trend yield. About a third of time reported yield is
at least 5% better than trend yield, and about a quarter of the time reported yield is at least 5% worse
than trend yield. For reference, the recent 2012 drought caused the reported yield to be 22% worse than the trend yield.
There is a one-in-four chance that we will see the stocks-to-use ratio drop to single digits, a level that typically
coincides with sharp price moves to the upside. There is a 1-in-12 chance that reported yield is 10% worse than trend yield,
which would lower the stocks-to-use ratio to about 1% (all else equal).
There are a couple of items that we learned from the 2012 drought:
-
Lower yields may hurt farmer sentiment short term, but crop insurance and higher crop prices ultimately
helped farmers medium-term more than the damage done by lower yields. Crop insurance enabled farmers to smooth
out the volatility caused by weather - Higher grain prices led to some demand reduction (culling of herds, etc)
The key point here is we could easily see $8-10 / bu corn over the next few years… there is not a lot of wiggle
room given current trends and unpredictable variables such as weather. Even if we get through this year with a
decent yield and moderate prices, there will likely be continued pressure on global stocks in the coming years.
We have just exited an eight-year bear market in corn that moderated risk-taking and speculative planting. More
importantly, it slowed the addition of new acreage in other parts of the world that did not produce corn in the past.
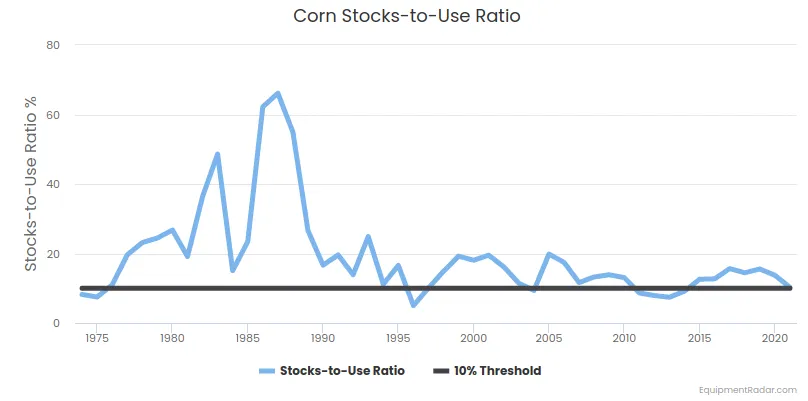
Source:
USDA NASS
Takeaway: Stocks-to-Use ratio long-term median level is 15%, and when it dips below 10% it typically corresponds with rising corn price.
Equipment Manufacturers Are Positive
John Deere reported
strong first-quarter 2021 earnings
on February 19, beating analyst estimates. On the
earnings call
management noted
“Ag fundamentals improved significantly throughout the first quarter and the improved sentiment is reflected
in the most recent status of our order books and early order programs”.
The outlook for fiscal year 2021
is very optimistic:
-
Large ag equipment sales in US & Canada equipment will be up between 15% and 20%
- Crop Care early order program that ended in October was up double digits
- Combine early order program ending in January was up double digits, outpacing Crop Care
- Large tractor order book now extends through most of the year, so Deere is increasing production rates
- Small ag and turf equipment in US & Canada are expected to be up 5%
- European ag market is forecast to grow about 5%, with a solid order book extending through most of 2021
-
South American ag is forecast to grow about 10%. Deere noted that private financing conditions are
improving in South America, providing better credit availability to farmers - Ag sales in Asia are expected to be down slightly
Ryan Campbell, Deere CFO, noted “We’ve seen underlying fundamentals continue to improve since the last
quarter. Higher commodity prices and improved market access have boosted sentiment in ag markets and are
reflected in the results of our early order programs and order books. In addition, we’ve seen further
strength and demand for compact utility tractors and turf equipment, as consumers continue to focus
on home and landscape projects.”
Used Tractor & Combine Auction Sales Prices Are Strengthening
“The (used equipment auction price) trend has been up recently since commodities
jumped up over the last few months. Equipment prices have jumped up too. Trends are definitely
stronger,” said Bill Sullivan, of
Sullivan Auctioneers
in Hamilton, Illinois. “I would say many prices have gone back to the 2012 peak.” Auctions across the US are reporting higher prices
for used tractors, combines, sprayers and planters across the board for all major manufacturers.
Conclusion
Agriculture commodities always have been and always will be in demand… We all need to eat. Agriculture
demand has weathered countless financial and political storms since civilization began. There is no telling
of what will happen with increased money printing — but there will always be demand for grain.
Historically speaking agriculture and land have been safe investments that weather political and monetary volatility. In addition,
the long-term cycles can be very powerful once they start. Typically prices increase by 3-4x during a long-term bull market, which
suggests even more upside beyond $8-10 / bu corn.
Find Similar Articles By Topic


