
Chainalysis Backs TON as Bearish Chart Warns of 40% Toncoin Crash …

Chainalysis has integrated The Open Network (TON) across its full product suite, expanding its blockchain coverage to one of the industry’s fastest-growing ecosystems. The company announced the move on July 10, confirming that TON is now fully supported on Reactor, KYT, Sentinel, Address Screening, and Data Solutions.
The update comes as TON secures a spot among the top 25 blockchains by market capitalization. Its rapid rise is largely tied to its exclusive partnership with Telegram, which has fueled increased network activity and user growth.

With the integration, Chainalysis will automatically support all fungible tokens deployed on the TON blockchain. This adds more than 671,000 new tokens to its monitoring scope, with the number growing daily. The company also introduced memo support for TON, allowing compliance teams to access and assess memo data as part of their risk analysis. Chainalysis confirmed that memo support will now extend to all other blockchains that use this feature.
The firm said the addition reflects its ongoing commitment to helping customers manage risk in an evolving crypto environment. By incorporating TON, Chainalysis aims to boost confidence for compliance and investigations related to one of the most active blockchain networks today.
TON Price Risks 40% Drop as Descending Triangle Pattern Emerges
Toncoin TON/USDT a descending triangle pattern on its daily chart, captured on July 11, 2025. The formation began developing in early April 2025 and now shows clear lower highs and a flat support line near $2.78. The price currently trades at $2.969 and aligns with the 50-day exponential moving average, which sits at $2.966.

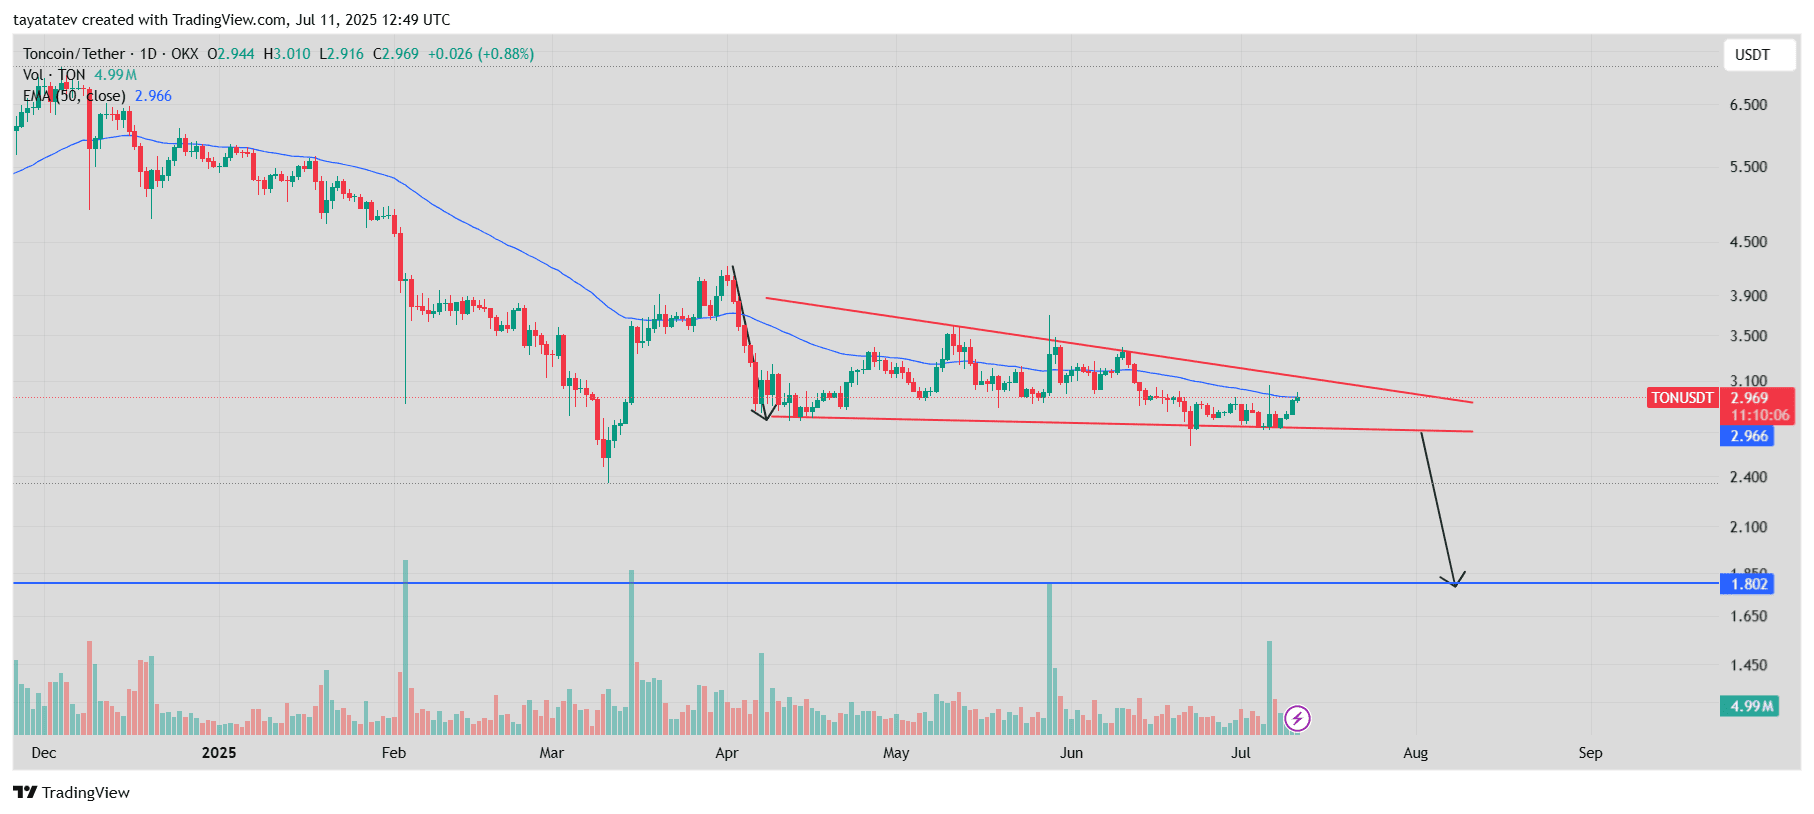
A descending triangle is a bearish continuation pattern formed by a horizontal support level and a downward-sloping resistance line. This setup typically signals weakening demand and increasing selling pressure.
The chart indicates that if TON confirms a breakdown below the $2.78 support level, the price could fall sharply. The projected move points to a potential drop toward $1.80—a nearly 40% decline from the current level. This downside target aligns with previous volume peaks and psychological price zones visible on the chart.
The pattern has developed over three months, reinforcing its validity. Unless TON breaks above the descending resistance line near $3.10 with strong volume, the bearish outlook may prevail.
TON MACD Turns Bullish With Fresh Crossover on Daily Chart
Toncoin (TON) shows the first bullish crossover in weeks on the Moving Average Convergence Divergence (MACD) indicator, based on the daily chart captured on July 11, 2025. The MACD line (blue) has crossed above the signal line (orange), with the histogram flipping positive for the first time since late June.
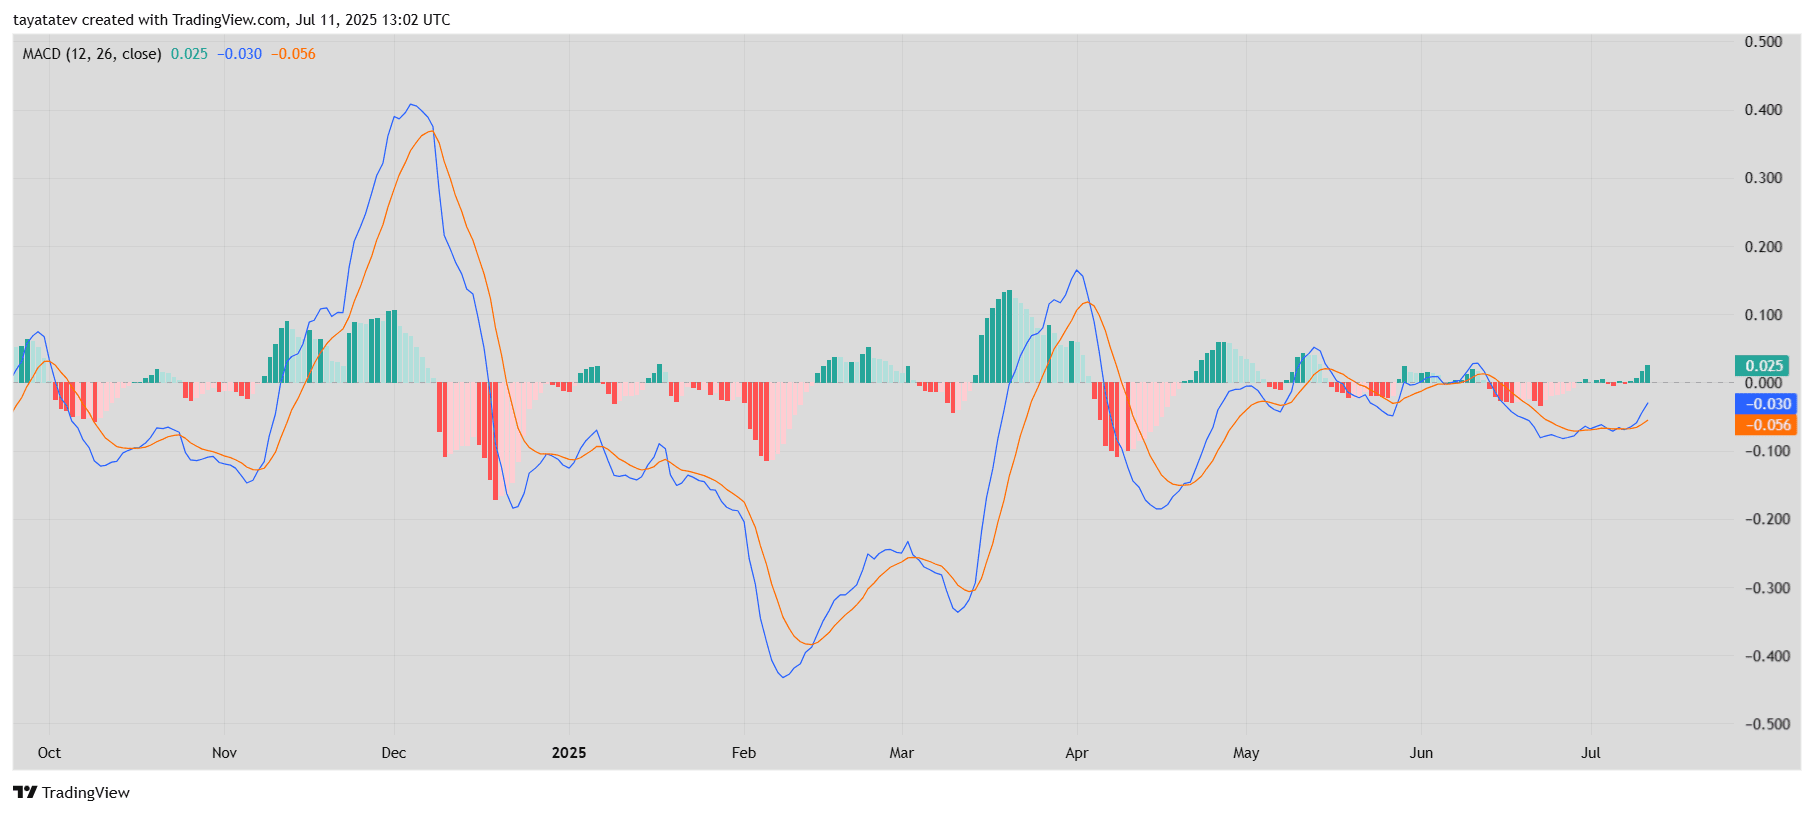
MACD, short for Moving Average Convergence Divergence, measures momentum by tracking the difference between two exponential moving averages—typically the 12-day and 26-day averages. When the MACD line crosses above the signal line, it suggests bullish momentum is building.
The crossover on July 11 follows weeks of tight, sideways price action, where the MACD histogram hovered near the zero line. This breakout, although modest, signals a potential shift in short-term trend strength. The MACD value is now 0.025, while the signal line remains at -0.030.
However, the current crossover remains shallow. For the signal to gain strength, the histogram must expand further, and the MACD line must continue rising above zero. Until then, the move reflects an early-stage shift rather than a confirmed trend reversal.
TON RSI Breaks Above Neutral Zone, Signals Building Strength
Toncoin (TON) is showing growing momentum as its 14-day Relative Strength Index (RSI) climbs to 55.41, based on the daily RSI chart published on July 11, 2025. The indicator has moved above the neutral 50 level for the first time since mid-June, signaling a short-term shift in buying pressure.
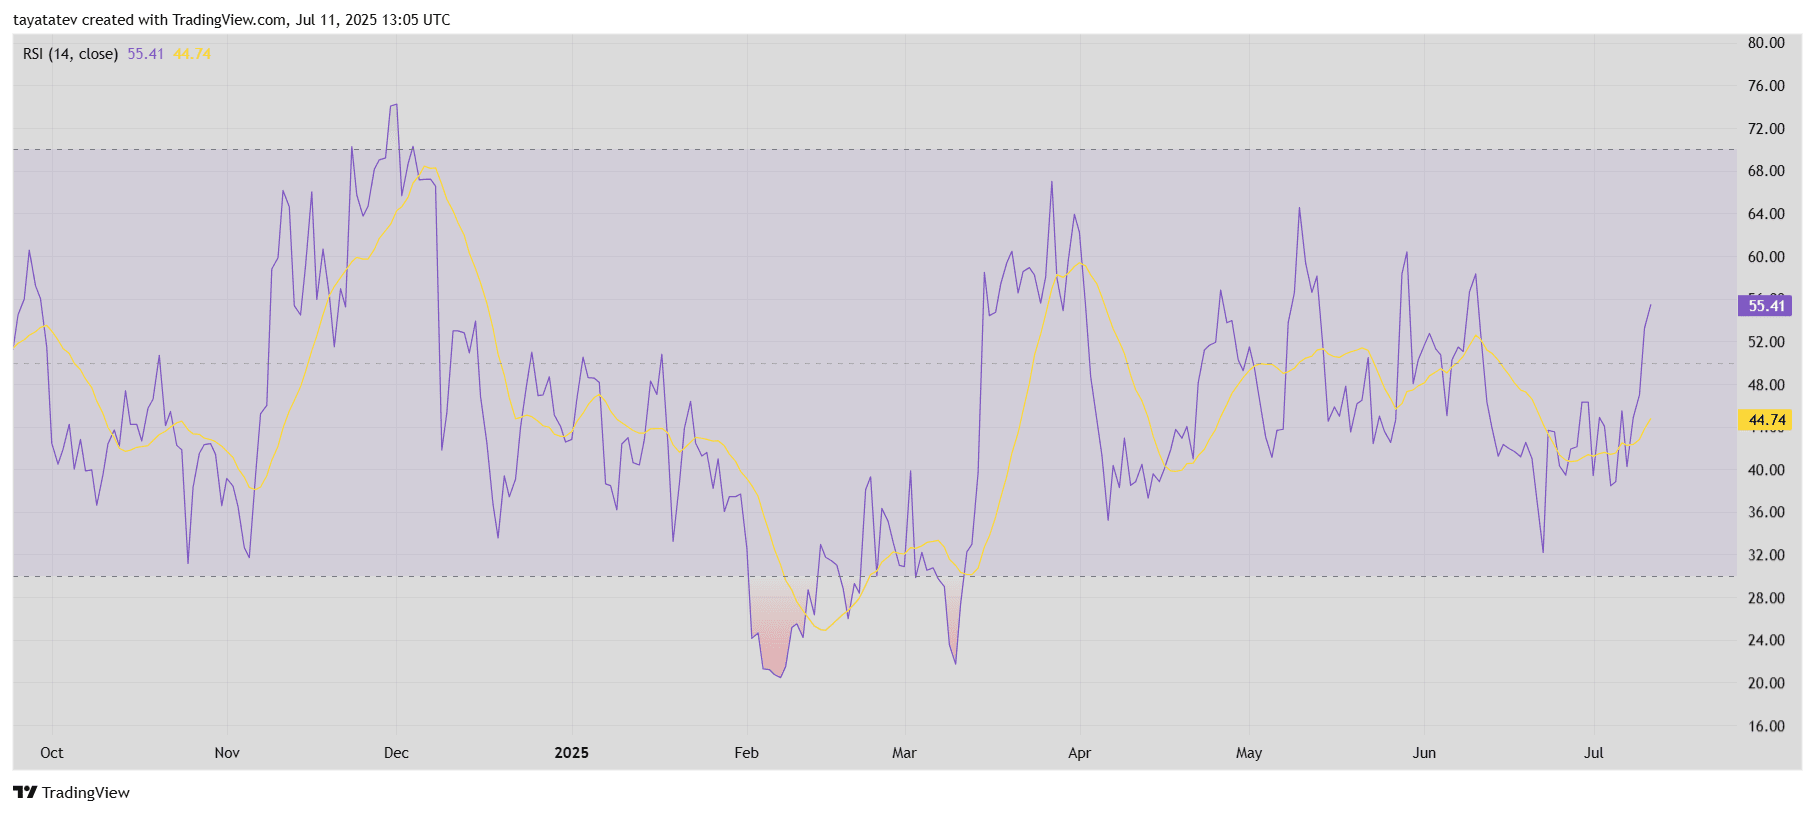
The Relative Strength Index, or RSI, measures the speed and change of price movements on a scale from 0 to 100. Readings above 70 typically indicate overbought conditions, while readings below 30 suggest oversold status. The mid-point at 50 often marks the line between bullish and bearish sentiment.
Currently, the RSI has broken above both its 50-line and the yellow signal curve, which stands at 44.74. This crossover and upward momentum reflect renewed buying interest after weeks of sideways consolidation. However, the move is not yet extreme, keeping TON in a zone where further upside remains possible without immediate risk of overbought pressure.
The RSI trend confirms what MACD also shows: early-stage bullish momentum is forming, though confirmation requires a strong follow-through in price action and volume.
TON Balance of Power Turns Positive, Suggests Buyers Regaining Control
Toncoin (TON) shows a rising Balance of Power (BOP) reading of 0.49 on the daily chart, indicating that buyers are starting to dominate the market. The BOP measures the strength of buying versus selling pressure and moves between +1 and -1. Values above zero point to buyer dominance, while values below zero suggest sellers have the upper hand.
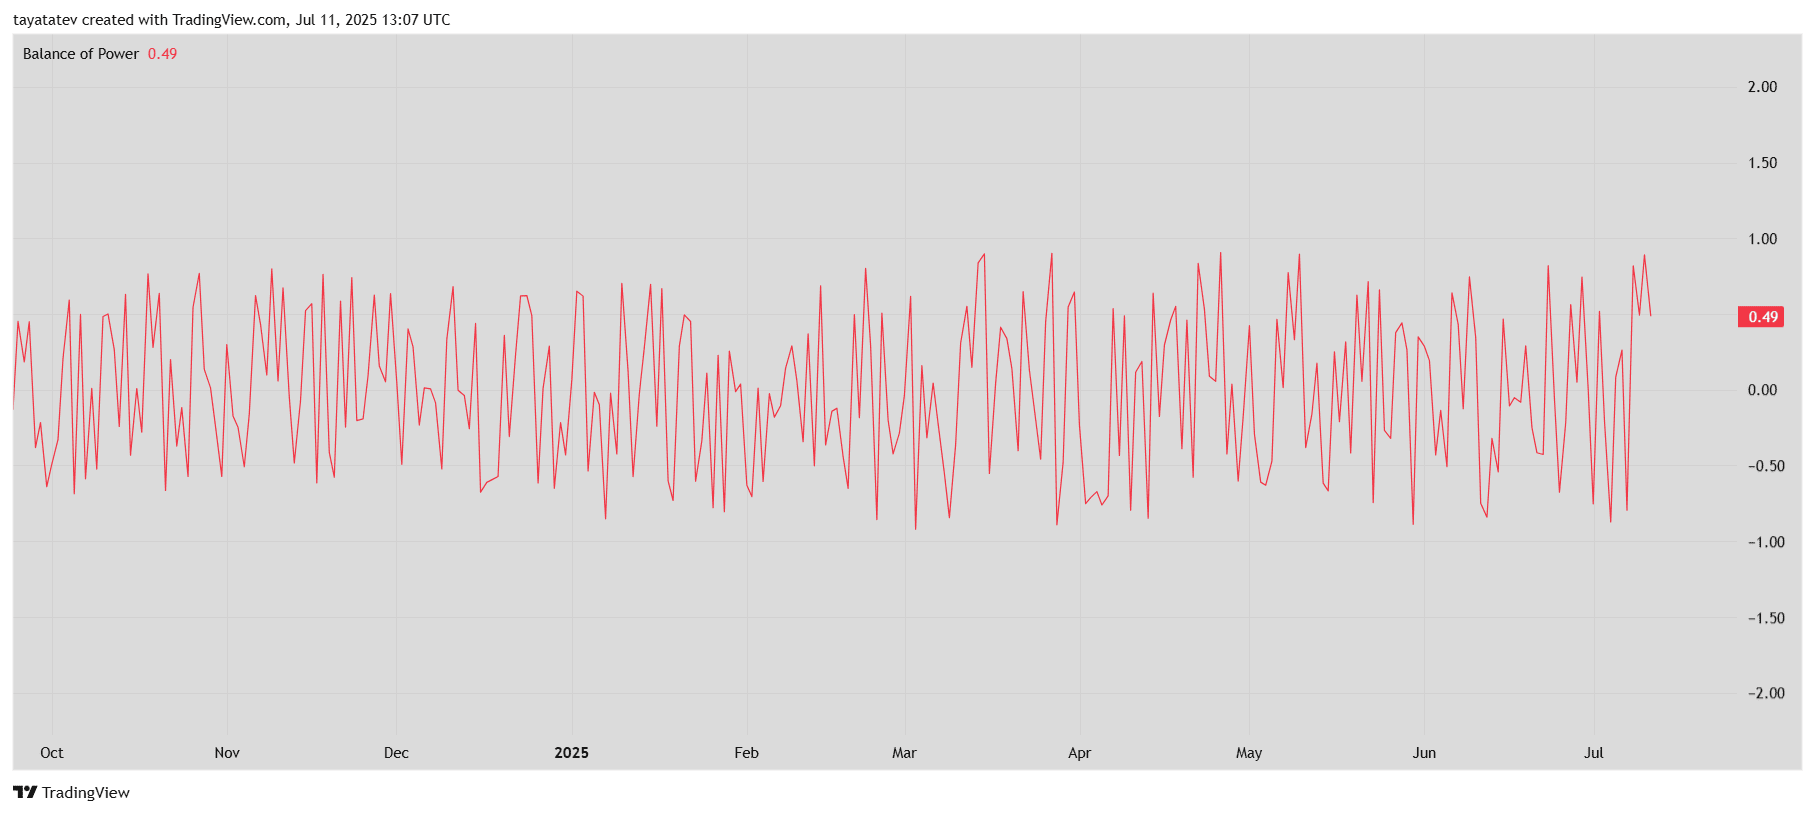
For most of June and early July, the BOP hovered around neutral or dipped below zero. The latest value near 0.50 marks one of the strongest buyer readings in recent weeks. This shift supports earlier signals from the Relative Strength Index (RSI) and the Moving Average Convergence Divergence (MACD), both of which indicate building bullish momentum.
However, the BOP remains highly volatile on the chart. While the current value favors buyers, consistent readings above 0.50 are needed to confirm sustained accumulation. If the BOP holds at this level or climbs further, it could validate the short-term trend reversal suggested by other momentum indicators.


