

In figure 1, the pen in John’s hand points to a column on the computer screen. On the same screen are other columns. But the column that John points to is the problem. “This column”, he explains, “has superior placement” over other columns. And to John, this superior placement is all wrong!
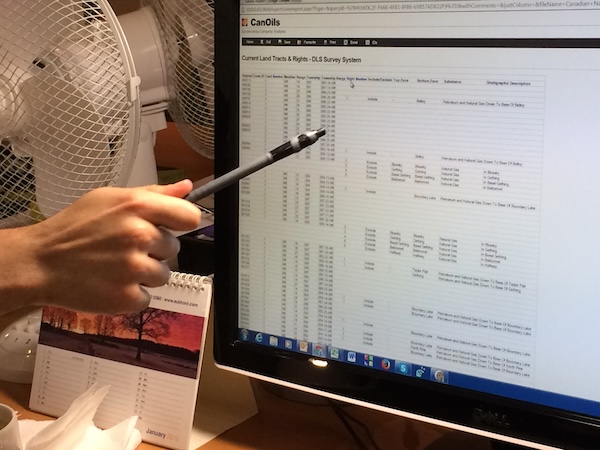
Figure 1. John points to a problem. Photo by author.
I begin this essay by noting that on Fashion Street in the White Chapel area of downtown London and inside a refurbished nineteenth century clothing factory – a handful of analysts including John, spend long hours managing a database on oil and gas corporate performance. These analysts compile and curate corporate data on energy procurement, mainly oil and natural gas production, so that clients, mainly investors, can better assess comparisons of individual (or peer group) corporate performance across industry.
Figure 2 shows two stacks of Oil and Gas Finance Trading, a glossy magazine reporting the latest news on global energy asset management. The copies in this image lay at the office entrance to where John works and are available for free to any visitor of the refurbished sweatshop. Within its pages, a glowing review celebrates the skills of John and his fellow analysts, describing them as gathering a wide range of operating data from the annual and quarterly reporting of over 300 publicly listed energy companies.
John applies quantitative methods for gaining insight into the operational efficiency and profitability of different companies so that his clients can “evaluate” energy corporate performance over time and relative to other corporate performances.
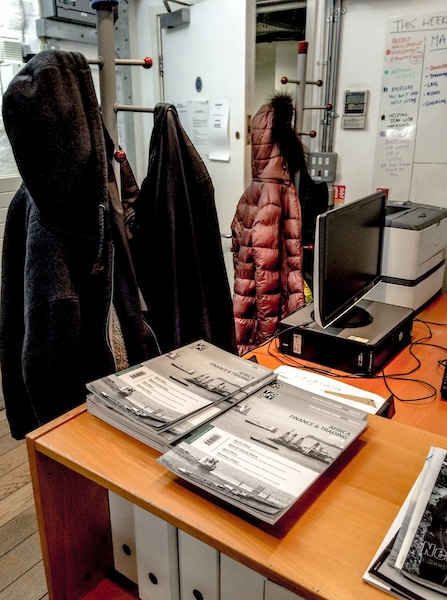
Figure 2. Copies at office entrance. Photo by author.
According to John’s description, he creates “financial ratios”. What this means I cannot say. But in telling me so, I gather that he applies quantitative methods for gaining insight into the operational efficiency and profitability of different companies so that his clients can “evaluate” energy corporate performance over time and relative to other corporate performances. Investors of corporate valuations frequently assume they have all the relevant data at their fingertips. But such confidence is misplaced if they do not understand the data management process. Thus, investors rely on data management vendors like John for his completeness, integrity, and timeliness of service for the quality of their business decisions.
My understanding of John’s data management activity involves at least two operations: first, he reaches across the internet extracting specified information, and second, through proprietary algorithms, he redistributes this information to the computer screen in a standardized visible format. This format enables clients to “evaluate” energy through making standardized comparisons of valuation, for example, operations of oil and gas wells within global basins, mergers and acquisitions, production licenses, and more, serving as the basis for client investment decisions. Given the need of investors to evaluate energy corporate performance and given the money they spend so that John can procure knowledge to evaluate energy companies, it should come as no surprise that the name of the company that John works for is, indeed, Evaluate Energy.
During my visit to Evaluate Energy I gained cursory insight into the way analysts work with data and how clients gain value from the Evaluate online proprietary database. Figure 3 depicts the office space where I observed the work routines of one dozen Evaluate analysts. Evaluate founder and CEO, Richard Krijgsman, who I met in Moscow at the 11th Russian Petroleum and Gas Congress or RPGC, coordinated my visit. Among the RPGC delegates attending from energy companies, contractors, and suppliers were high ranking employees of Gazprom, Rosneft, Schlumberger, and Halliburton. The congress also attracts CEOs of consulting firms like Richard Krijgsman who aim to identify new clients.

Figure 3. Evaluate office. Photo by author.
Before returning to the problem that I began this story with, of the wrongness of a column’s superior placement on a computer screen, I want to mention that my awareness of this wrong came about because of my curiosity over John’s physical movement at the Evaluate office.
To explain: analysts at the Evaluate office spend long days staring at their computer screens gathering data and managing financial reporting on oil and gas developments. The day begins at 9:30AM and ends at 5PM. Often, I encountered analysts in the office between 8AM and 7PM. They take lunch breaks no longer than 45 minutes outside the office and oftentimes eat at their desks. Apart from eyeball movement, blinking, and constant finger typing, there is little bodily movement throughout the day. The din of fingers typing onto plastic keyboards is constant. I recorded the sound of the room with its steady striking of the keyboard and which I invite you to listen as you read the remaining part of the essay.
Sound memo of typing. Recording by author.
Analysts will get up from theirs chairs to walk across the room to a toilet located in the office, but they otherwise avoid any intentional movements like standing up and stretching. Notably, verbal exchange was not as frequent as I expected given the analysts proximity to each other. Only rarely did an analyst physically move to the workstation of another analyst. The only examples that I can recall took place when, first, an analyst would walk by each station inquiring whether she could prepare a cup of tea; and second, when an analyst moved his chair to the workstation of another analyst with the aim of solving a problem that could not be managed through electronic communication.
Analysts are offline no more than three hours during any day of the work week.
To explain further: the analysts in the room constantly chat with each other over Skype. In fact, the analysts of Fashion Street compose only one-third of the Evaluate Universe. Continuous exchange over Skype integrates members of this London Team with analysts who belong to an India Team working in Ahmedabad and to members of a Canada Team working in Calgary. The geographical spread of these teams also spreads the workday to 21 hours. In this way, Evaluate analysts are offline no more than three hours during any day of the work week. Translated into Greenwich meantime, Evaluate hours of operation begin at 4:30 AM (9:30 AM India Standard Time) and end 1:30 AM (6:30 PM Calgary Time).

Figure 4. Seating at Evaluate. Photo by author.
Initially, the lack of movement throughout the office appeared to me so unusual that when John finally did move his chair to a different workstation, I could not help but take notice of the location change as an event with dramaturgical form. Figure 4 is a cropped copy of figure 3 above and provides an image of the spatial order of the London Team of Evaluate analysts. In this image, I have placed an orange arrow above John sitting in his chair on the left and I have placed a red arrow above Hannah sitting in her chair on the right. John is a senior analyst responsible for managing financial research data on global oil and gas development and is the go-to person for troubleshooting problems with the database.

Figure 5. The drama. Photo by author.
The visibility of these firms reflects a reliance on advisory services that try to identify uncertainties and to help industry actors have the capacity to be ready for them.
In figure 5, John is shown having had already moved his chair across the ocean of space that routinely and quite necessarily separates these two analysts. He is there, seated next to Hannah, in his chair that he has moved by himself and with the given reason that his movement was necessary for assisting Hannah with a problem that cannot be resolved over internet exchange. He needed to move his chair.
In the remainder of this essay, I discuss the dramaturgical form that leads one analyst, namely John, to move his chair to a fellow analyst’s workstation. My broader aim is to provide context on the internal practices of analysts and the types of firms they work for. Consulting firms, data vendors, and other types of companies that repackage hard-to-find data combine technical prediction with new forms of visualization. They are important for the knowledge they generate and ritual-like learning environments they create. I consider these analysts intermediary actors because of their success in mobilizing expectations. The visibility of these firms reflects a reliance on advisory services that try to identify uncertainties and to help industry actors have the capacity to be ready for them. By mediating an ensemble of relations about industry, intermediaries may be seen as transnational agents who exert control over economies regulated through the national state.
Energy development is one of several industries reliant upon intermediaries and understanding the results of this reliance sheds light on society. Energy determinations are detailed expectations that represent strategic resources for attracting attention from (financial) sponsors to stimulate agenda-setting processes. I have long considered intermediary practice composed of assembling, mobilizing, and performing. Thus, my fieldwork at Evaluate Energy is part of a program of questioning how intermediaries generate the future for an industry requiring fundamental perspectives for developing frontiers.
Returning now to the beginning when John demonstrates through hand gesture the wrongful positioning of a column on the computer screen: I suggest that what motivates John to abandon his workstation and to undertake a voyage across the aisle – to allow the wheels of his chair to drift toward Hannah – is the presence of regulation and its desired absence. Regulation has artefactual presence on the website. Evaluate Energy clients require its absence. In this way, the problematic issue of regulation ties John to Hannah. Regulation fuses analysts to each other in the form of physical fellowship.
Looking back to figure 1 above, the numbers and figures that populate the columns appearing on the computer screen make up the backstage arrangement of the Evaluate database on oil and gas deposits. John’s central concern is the way the data arranged on this backstage appears on the frontstage of the Evaluate webpage, that is, the parts of the Evaluate database that become visible to and interact directly with John’s clients. As depicted in figure 1, the backstage columns carry hierarchical relation where their positioning on the screen determines the aesthetics of placement on the frontstage of clients’ visible experience of data.
John’s aim is to “take out” the superiority of this regulatory identity so that clients can work with these deposits by reference to their aesthetic function in terms of a purely economic performance.
As John explains to me, clients looking at the Evaluate webpage want to understand how the geological location of an individual oil and gas deposit or a group of deposits may be identified by reference to the company with the working interest rights. Clients want to know the private entity that governs these assets from a purely economic performance perspective. Connecting the performance of an oil and gas deposit to the entity working the asset – is what interests John’s clients. John must rearrange the columns at the backstage so that the outlook of a geological location of an oil and gas deposit and its working interest carry an aesthetic function that dominates over all other information that appears on the website frontstage.
To do this, John explains that he must arrange the columns of numbers at the backstage in a way that disaggregates his “client-interest information” from the predominantly regulatory knowledge that is historically integral to imposing an identity over such assets. In figure 1, the column that John points to and of the columns that reside nearby – all refer to information about western Canadian oil and gas deposits. These Canadian deposits take their names by reference to their location in a township and by their federally assigned identification number. In this way, the information available to John for understanding Canadian oil and gas deposits takes its original shape by reference to regulatory authority. John’s aim is to “take out” the superiority of this regulatory identity so that clients can work with these deposits by reference to their aesthetic function in terms of a purely economic performance.
The example draws attention to the highly concentrated ownership pattern of oil and natural gas in North America among private entities with working interests but where the federally assigned terms and identifications carry conceptual and historical meanings relating to a regulatory authority over interests. As written in constitutions, only sovereign governments own minerals. What companies possess are leases to recover known and potential oil and gas. By acquiring leases through sales, companies are, for the purpose of their investors, owners of natural resources, and for whom investors turn to analysts with the aim casting further afield the arms-length transactions of governments.
The key backstage function is regulatory.
Delving further into figure 1: each of the numbers in the column on the left of the screen lay under the heading “Crown Land” and each of these numbers represents an “unique well identifier” or UWI that has been assigned to an individual tract of land by the Ministry of Energy and Natural Resources of Canada. To the right is another column of numbers under the heading “Township Range”. In this column, each of the numbers identifies the geographical surface location of an individual tract of land. Finally, on the very far right is a column of numbers under the heading “Stratigraphic Description” which describes the names of the actual stratigraphic layer belonging to an individual tract.
Thus, the key backstage function is regulatory. The problem for John, is to disaggregate the prominence of the “Crown Land” UWIs from the stratigraphic layer belonging to an individual tract. Clients at the frontstage want to know the economic performance of a stratigraphic layer belonging to an individual tract, and they want to know which company has the drilling/commercialization rights and is performing the working interest – more than they want to know the regulatory identity or UWI.
To be specific, directly in the middle of figure 1 are columns titled “Top Zone” and “Bottom Zone”. These columns refer to distinct geological layers with separate working interests. The columns to the left are titled “Include/Exclude” and indicate whether a geological layer is part of a particular tract. The problem therefore is re-arranging the columns “Township Range” and “Crown Land” so that client interest in “stratigraphic permissions” can appear across the computer screen in a more legible manner. Clients want to know who has permission to the working interest of these different stratigraphic layers more than they want to know the UWI that identifies the actual oil and gas wells.

Figure 6: Writing notes. Photo by author.
Thus, the voyage of an analyst’s chair aims to create aesthetic legibility for clients at the frontstage through rearranging the backstage hierarchy: geological location and township identity can more closely identify the working interest rights than a federally assigned identification. After discussing how to remedy the problem John and Hannah develop a plan to rearrange the screen appearance of data. Hannah takes notes on how to move forward in figure 6. The list of hand-written tasks for rearranging this taxonomy is then reduced to a short sentence and input into a computer program workflow alongside Hannah’s other list of activities.
While economic functions arise from the coordination of productive enterprise, regulatory authority derives its usefulness of a centralized, institutionalized, and territorialized management of governing relations. The aim of the Evaluate Universe is to disaggregate the regulatory interests from its accommodation with different economic configurations. On the frontstage, at the website computer screen, clients want to see oil and gas deposits as distinct assets among different stratigraphic geological layers and the individual permissions of working interest for each layer. John wants to separate out the regulatory function of knowledge assigned to data that governments make available and that he gathers for clients whose interests are not regulatory but purely economic. In this way, while regulation and economics are mutually dependent and closely intertwined, for investors and their data vendors, they are neither financially and thus nor visually so.
Featured image: Writing notes. Photo by author.
Abstract: In this essay, I describe the movement of a chair in a London sweatshop because of oil and gas regulation taking place in Canada. The same regulation created to manage oil and gas in geological space also regulates the movements of a chair in office space. The example draws attention to the highly concentrated ownership pattern of oil and natural gas in North America among private entities with working interests but where terms such as Crown Land and Township Range carry conceptual and historical meanings relating to a regulatory authority over interests. As written in constitutions of states, provinces, territories, and federal authorities, only sovereign governments own minerals. Such resources cannot be alienated (sold). What companies possess legally are leases through which they acquire a working interest to recover known and potential oil and gas. But the working interest entitles companies to explore, produce, process, and sell oil and natural gas. By acquiring leases through sales conducted by government resource departments, companies are, for the purpose of their investors, owners of natural resources, and for whom investors turn to analysts with the aim casting further afield the arms-length transactions of federal governments and other states, territories, and provinces.


