
This article continues with the LED tests, and presents data on light intensity and spread, along with the spectral distribution of light for some new and latest generation European LED fixtures. Table 1 presents a list of the LED lighting fixtures reviewed in this article. For a description of the methodology and previous test results see https://reefbuilders.com/2024/10/01/radion-g6-gnc-bluray-x-and-ai-blade-coral-grow-led-light-test/ .
Table 1: Light fixtures tested
| LED Fixture | Picture |
| Phillips CoralCare Gen 2 |  |
| GHL LX7506 IL Coral Pop |  |
Phillips Coral Care Gen2
The Phillips CoralCare Gen 2 light uses 68 different LEDs arranged in 2 wirelessly controlled channels with 6 different wavelengths. Table 2 shows the number and type of LEDs in each channel, and Figure 1 shows the placement/arrangement of these LEDs in the fixture. It relies on passive cooling thus eliminating the need for cooling fans. The light weights about 7kg (15.4 lbs), with dimensions of 460X410X57 (mm) / (18.11″ X16.4″ X 2.24″). Additionally it provides IP65 rated water protection. “IP” stands for “Ingress Protection” and the numbers indicate the level of protection against solids (first digit) and liquids (second digit). An IP 65 rating means a device is completely protected against dust ingress and can withstand low-pressure water jets from any direction, essentially signifying a high level of dust proof and water resistance, making it suitable for most outdoor applications where heavy rain or water spray is present. Hence making it suitable for use in a humid saltwater aquarium environment.
Table 2: Distribution and number of LEDs used in the Phillips CoralCare Gen 2
| Channel 1 | Channel 2 |
|---|---|
| 4x Luxeon C PC-Amber | 12x Luxeon C Blue 470nm |
| 4x Luxeon C Cyan 490nm | 6x Luxeon UV U1 415nm |
| 20x Luxeon V2 6500k | 16x Luxeon C Royal Blue 450nm |
| 6x Luxeon C Royal Blue 450nm |
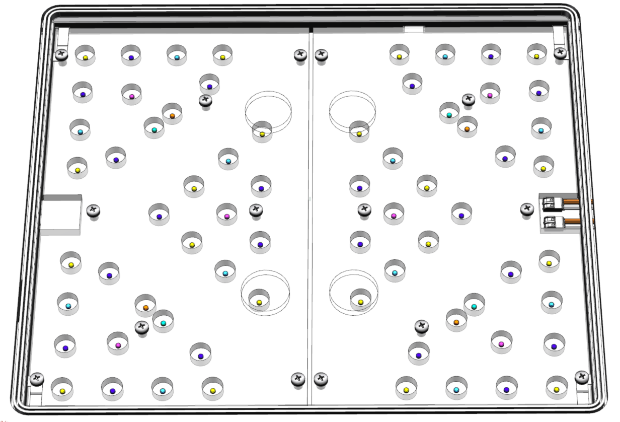
Figure 1. Placement of LEDs in the Phillips CoralCare Gen 2
Spectrum Report – Phillips CoralCare Gen 2
Figure 2 shows the spectrum analysis. The peak spectrum is at 447 nm. The spectral plot also shows the lumped PFD measurements for Blue, Green, Red, UV and Far Red. The color coordinates are also indicated in the CIE diagrams as color coordinates.

Figure 2: Spectral Analysis of Phillips Coral Care Gen 2
Light Distribution
Figure 3 shows the spread and intensity as measured at the 169 points on the 3X3ft grid. Peak values obtained at 24” were 201.5 (?moles/m2/sec) , and 134 at 30”.
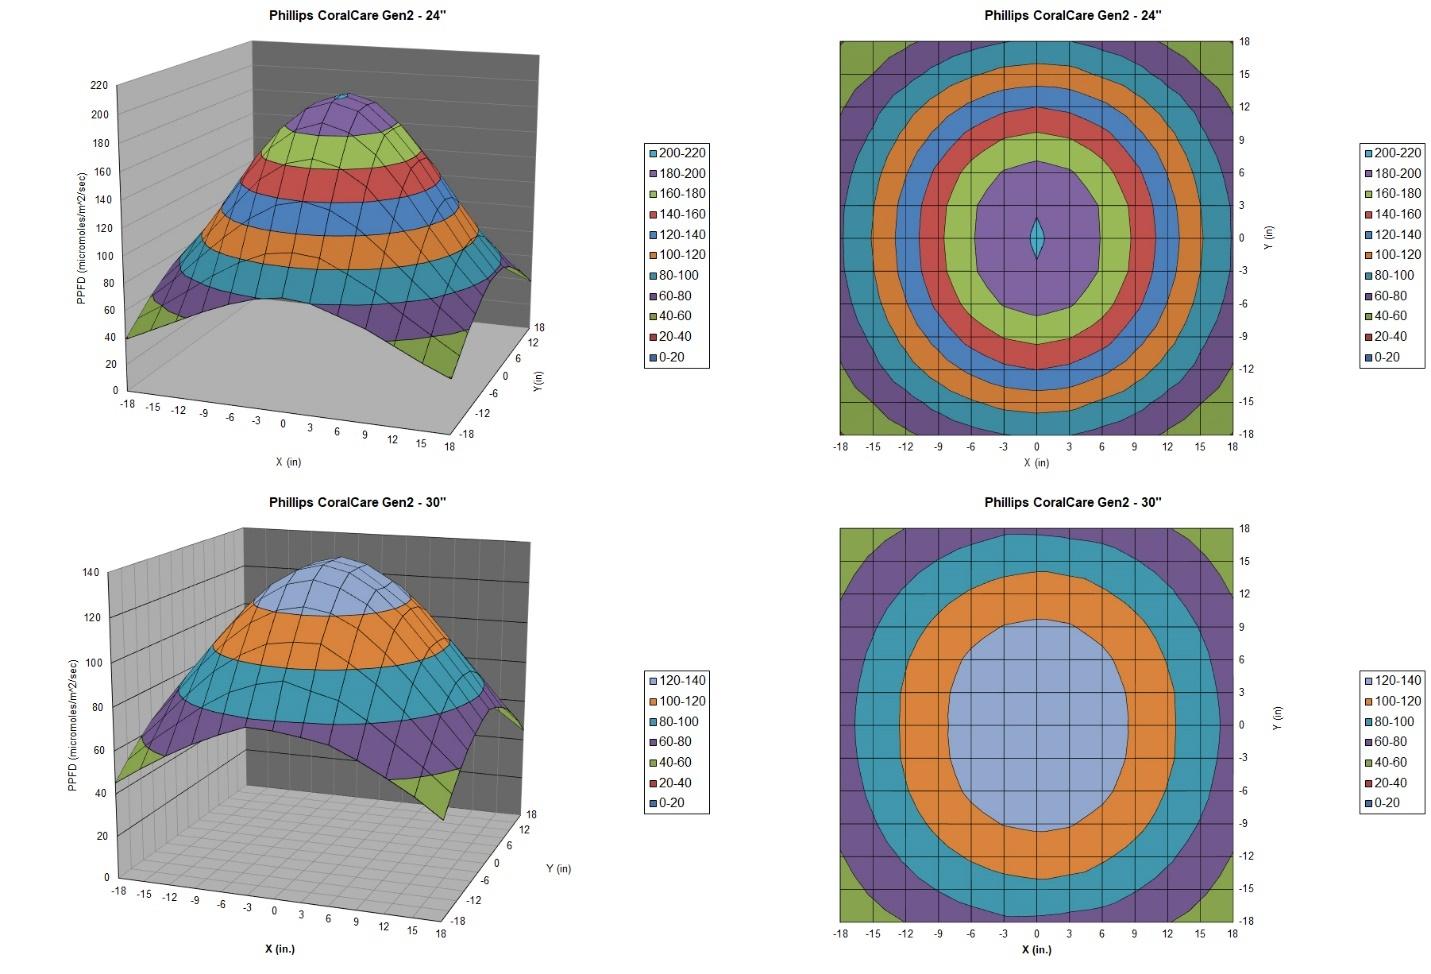
Figure 3: Spread and Intensity Plot for Phillips Coral Care Gen 2
GHL LX 7506 IL Coral Pop
The GHL LX 7506 IL Coral Pop is the newest GHL light. It uses 72 LEDs arranged in 6 clusters of LEDs with 12 LEDs of 9 different wavelengths. Each of the different wavelengths can be individually controlled and programmed via a wireless app. Table 3 shows the number and type of LEDs in each cluster.
Table 3: Distribution and number of LEDs used in the GHL LX7506 IL Coral Pop
| #of clusters | Each Cluster | Total LEDs |
| 6 | 2 x blue2 x royal blue2 x deep blue1x hyper violet1x deep violet1x UVA1 x cold white1 x cool white1 x daylight white | 72 |
| Each of the 9 colors is a separately controllable channel | ||
It relies on passive cooling via a heavy heat sink, thus eliminating the need for cooling fans. The light weights about 5.1 kg (11.2 lbs.) with dimensions of 420 mm x 230 mm x 60 mm (16.5″ x 9.1″ x 2.36″). Additionally, it provides IP67 rated water protection, which allows for strong protection against dust, high humidity, water splashing, and even brief, accidental immersion. The light can be operated in high efficiency or high-power mode. The tests were performed at the high-power mode where the power draw is listed as 250W.
Spectrum Report – GHL LX 7506 IL Coral Pop
Figure 4 shows the results of the spectrum analysis. The peak spectrum is at – 447 nm. The spectral plot also shows the lumped PFD measurements for Blue, Green, Red, UV and Far Red. The color coordinates are also indicated in the CIE diagrams as color coordinates
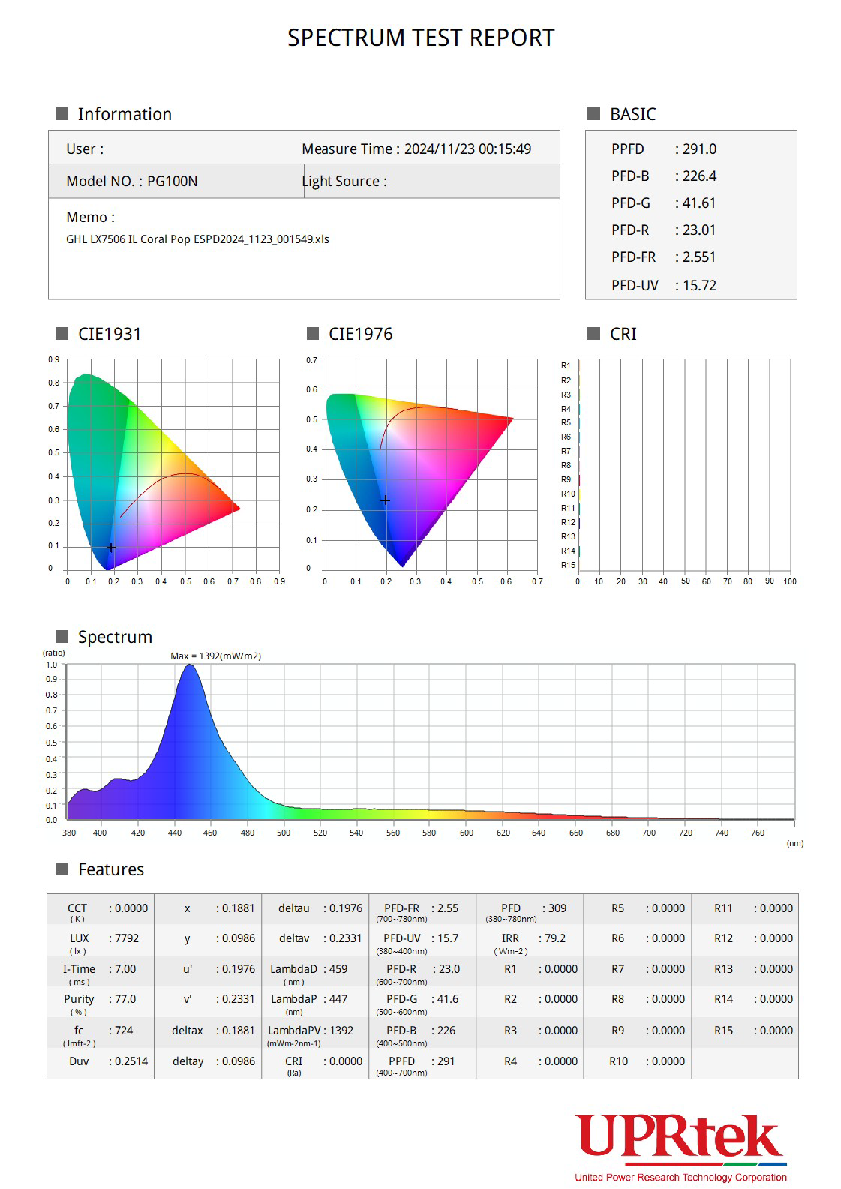
Figure 4 – Spectral Report for GHL LX7506 IL Coral Pop
Light Distribution
Figure 5 shows the spread and intensity as measured at the 169 points on the 3X3ft grid. Peak values obtained at 24” were 279.8 (?moles/m2/sec) , and 178.1 at 30”.
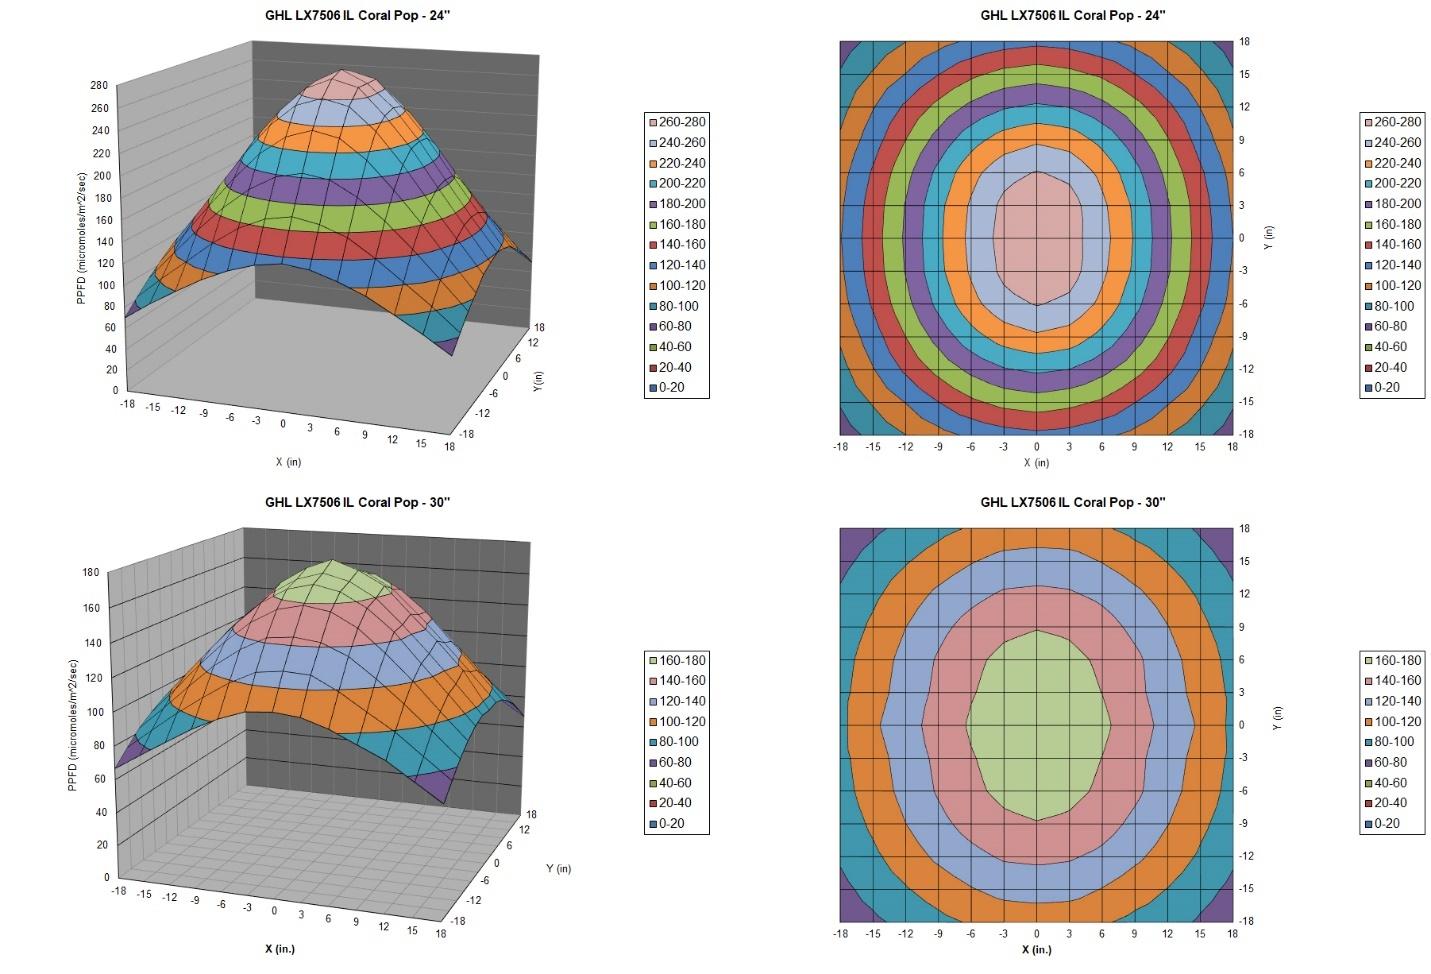
Figure 5: Spread and Intensity Plot for GHL LX7506 IL Coral Pop
Comparisons
Figure 9 below shows the comparison plot of the spectral distribution. Typical plots of spectral distribution (as shown earlier in the UPRtek reports) are usually individually scaled to the peak spectral value by setting it equal to 1. Since different LEDs may have different spectral peaks hence these plots do not provide an accurate comparison of the outputs at different wavelengths. To facilitate actual comparison of the output, it is more useful to scale the plots based on total PPFD rather than using a single spectral peak. In this paper, the spectral plots are scaled to a PPFD value of 175 for purpose of comparison.
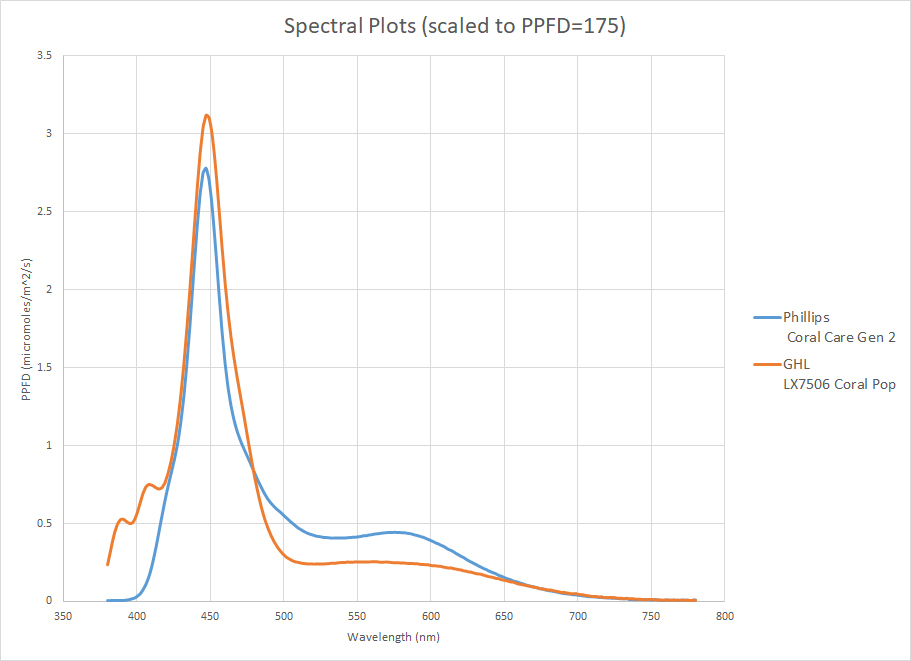
Figure 9. Spectrum comparisons scaled to equal PPFD of 175
The actual PPFD measured at a distance of 23.25 from the center of the LED fixture and the grouping to create the lumped PFD over a range of wavelengths along with the UV and Far Red measurements are shown in Table 3. It should be noted that these are single point measurements and can be heavily influenced by the optics used.
Table 3: PPFD measurements and lumped PFD in various wavelength bands
| LED | PPFD | PFD-UV(380-400 nm) | PFD – Blue(400-500 nm) | PFD- Green(500-600nm) | PFD-RED(600-700 nm) | PFD-FR(700-780nm) |
| Phillips CoralCare Gen2 | 201.4 | 0.29 | 130.6 | 50.0 | 20.6 | 1.7 |
| GHL LX7506 IL Coral Pop | 291 | 15.72 | 226.4 | 41.61 | 23.01 | 2.55 |
Each of the LED fixtures has a different power draw, as shown in Table 4. Generally, the more power consumed results in higher total light output, but the optics used in the fixture can change the distribution of the light.
Table 4: Power Comparison Table
| LED | Power (W) | Volts (V) | Amps (A) |
| Phillips CoralCare Gen2 | 167.9 | 122.2 | 1.38 |
| GHL LX7506 IL Coral Pop | 251.7 | 122.0 | 2.09 |
Other comparisons that can be made using the data, can look at the total and average PPFD over the 3ft area (169 pts) and 2ft area (81 pts). Since the intensity of the light is also a function of the power used, a metric using average PPFD/watt can be used to get a sense of the efficiency of the light by normalizing to the power input. This is presented in Table 5.
Table 5: Total and Average PPFD over the 3X3ft and 2X2 ft area.
| LED | Distance | Total 3X3ft | Average – 3X3 ft | Av. PPFD /Watt | Total 2X2ft | Average – 2X2 ft | Av. PPFD /watt |
| Phillips CoralCareGen 2 | 24” | 18573.5 | 109.90 | 0.65 | 11989.7 | 148.02 | 0.88 |
| 30” | 15479.8 | 91.60 | 0.55 | 9179.6 | 113.33 | 0.67 | |
| GHL LX7506 IL Coral Pop | 24” | 27702.1 | 163.92 | 0.65 | 17109.9 | 211.23 | 0.84 |
| 30” | 20372.3 | 120.55 | 0.48 | 11750 | 145.06 | 0.58 |
Conclusions
LED lighting has continued to provide more choices to the reef aquarists. Hopefully this comparative data will help the aquarist make an informed choice on what to expect from the individual LED fixtures and how best to utilize them to achieve the desired coverage and light intensity.


