Buffer Protection Investment Solutions – Probably Work the Same Way as a Balanced Portfolio Long Term.
A few weeks ago, I came across the work of AQR’s Cliff Asness on Buffered Strategies. Buffered Strategies is a group of products that want to earn equity-like returns but with safety net that reduce the downside.
Most investors are less sophisticated, and emotionally cannot take volatility to the downside. If you have products that give you decent returns but make your investment more livable emotionally, would you be interested?
I think many would, which is why I think buffered strategy products is going to get more popular.
But AQR’s Cliff Asness argues that: We are overcomplicating things. These buffered products are costly, but most importantly, many investors didn’t realize they could achieve the same effect by investing in a higher fixed income allocation portfolio. He thinks that we are overly complicating things.
I do agree with Cliff.
I think there aren’t much visible differences to that significant degree for me to tell you buffered strategies have their appeal.
I think Cliff’s work, as well as Morningstar’s Managing Director of research Jeffrey Ptak work is helpful for us to understand better:
- Rebuffed: A Closer Look at Options-Based Strategies | AQR
- Buffer Madness | AQR
- Buffer ETFs: They’ve Worked but Timing Matters
- Another Quick Post on Buffer ETFs
- Buffer Beef
I have collate some of the significant evidenced-based takeaways below. Before we start, lets explain roughly how some of these buffered strategies will work.
How Does Buffered Strategies Work?
A buffered strategy is an investment strategy that tries to help protect some of the downside.
Most of us would like to invest in equities for the higher returns.
But we don’t want so much of the downside and the emotional uncertainties that comes with it.
Buffered strategies provide… a buffer for the downside. But I thin the right word might be they provide a safety net.
The best to illustrate this is explain using a payoff diagram. This one is from Global X, which is an ETF house that provide a fair bit of these options-related ETF strategies:

Focus on the blue dotted lines first.
The blue dotted lines show the profit and loss (Vertical axis) based on how the asset price changes (Horizontal axis). If your asset price is higher than your purchase you make more and more positive profit. However, if your asset price is below your purchase, you make losses.
Now the payoff with the buffered strategy is the orange line:
- Your upside is cap at a certain point. That is, if the underlying asset, say S&P 500 goes up 20% for that period, you won’t earn so much.
- There is some sort of downside protection. Focus on the Buffer Protection. This means if the underlying asset loses X%, your downside is still 0%.
- However, if the losses in the underlying exceeds a certain point, you will start losing money.
How they implement this might be with an underlying asset and options, using all options or some swap-based ETFs and options.
We can expand the diagram above in this step by step manner:

- The first step is to have some index exposure that gives us a 1 to 1 exposure to the underlying risk of a market and the corresponding returns. You can think of this as your S&P 500, Nasdaq, Hang Seng or what not.
- The second step is to buy a bearish put spread (buy a closer put, sell a further put) to protect a certain percentage of downside. In indexed universal life, the protection might be just an at-the-money put. A put spread as a whole, is less costly than just a put. This will affect the cap to the upside required to fund it.
- The third step is to sell an out-of-money call option. You earn a premium and this premium funds the spread in step 2. The last illustration shows us where we sell this call changes over time, depending on how costly the protection in step 2 is.
- We will rinse and repeat this periodically.
You can take a look at how Global X explains it: The Case for a Defined-Outcome Strategy
What you need to take note of is that:
- The Caps might not be consistent. The strategies will tell you the cap changes so its not always a fix 10% cap on returns. They will usually give you a range.
- The amount of loss protection will also depend on the strategy. Some strategy tries to protect a small amount, while some protect everything.
- There are no free lunches. If you want to protect something, it comes at some sort of costs. And we can see the cost as evidence:
- A Defined Outcome product that protects all the downside, will have a lower Cap than a product that you will still experienced some sort of downside.
- For example, a product that protects the first 19% of the losses (Innovator Defined Wealth Shield ETF (BALT)) capped the returns at 2.29% only.
- Options protections are put in define periods, but drawdowns can take place anytime. Thus, the effectiveness of these protections might not match exactly. This creates uncertainty in how well your investments are protected.
What are the Products That Will Fall Under this Buffered Strategy Bucket?
Whoa.. I think more and more, we are going to see them.
Here is a list of them (in no particular order or preference):
- Syfe S&P 500 downside protection portfolio
- Singlife Index Universal Life for Legacy planning
- Manulife Index Universal Life for Legacy planning
- S&P 500 Annual Buffer UCITS ETF (SPAB) available on IBKR
- FT Vest US Equity Moderate Buffer ETF (GMAY) available on IBKR
There are probably tons more listed in the US or even unlisted for me to list them out.
My ex-colleague Mike tells me aside from Universal life, we are going to get Indexed ILPs soon!
With that done, let’s see what Cliff Asness wants to say about the data.
Buffer Strategy Funds Does Not Produce Better Returns But They Do Result in Smaller Drawdowns.
Of the 624 funds available in Morningstar’s options related categories, AQR examined 99 of them with history going back to 1st Jan 2020.
Cliff ask 2 questions:
- Did their total returns exceed the S&P 500 return? (I take it that is what most strategy set out to do. Their reference point is a US market)
- Did the worst drawdown (fall from a certain peak) is less severe than something like the S&P 500?

The answer to the 1st question is no. If you look at the results breakdown in the matrix above the Better column is 0% and 0%.
The answer to the 2nd question is 86% have better drawdown or in other words they have drawdown of smaller magnitude.
A Simple Passive 70% Equity 30% US Treasury Bill Strategy can Achieve the Same Effect.
Cliff argues that usually these strategy end up reducing your exposure to market risk. You reduce exposure at the right time, you don’t take on the risk.

The chart above shows the exposure to the S&P 500 of each funds, bucketed by various percentages. 0.05 means 5%. 0.65 means 65%. So we can see that there is a distribution of returns with a lot of funds falling between 35% to 80% exposure to the S&P 500.
If the exposure is this low, then why not just invest in a 60-80% equity with the rest being in cash or fixed income?
So Cliff compare the performance of these funds that does buffered strategies to a 70% equity 30% US Treasury bills strategy:

What we see is that yes, there are some funds that does better than a 70% equity and 30% allocation (the 5% and 9% boxes). But when we examine, only 19% (14% + 5%) buffer strategies have a better drawdown profile then a simple passive strategy.
If we look at the Better/Better box, only 5% of buffered strategies did better and 72% fall in the Worse/Worse. Against a more Treasury Bill strategy.
This coincides with the advise we usually give clients: Sometimes you want a larger cash allocations because you think the market is not cheap. Perhaps instead of waiting you could just invest in a balanced or growth allocation [60% equity and 40% fixed income, 80% equity and 20% fixed income respectively].
You are likely to achieve the same effect with less emotional deliberation.
Breaking Down that 70/30 Comparison by Fund Category
Cliff says people find that 99 fund comparison to be too shallow because he grouped them together. So he took that same result that you see above and broke them down by Morningstar’s category Derivative Income, Defined Outcome and Equity Hedged:

- The equity hedged delivered the best return but only 9% can be better with a smaller drawdown.
- Majority of the funds are Worse/Worse!
- Derivative Income and Equity Hedge have the highest Worse/Worse
- Defined outcome or where the Buffered Funds will fall into have more better drawdowns than the rest (38% Worse return but Better drawdown.)
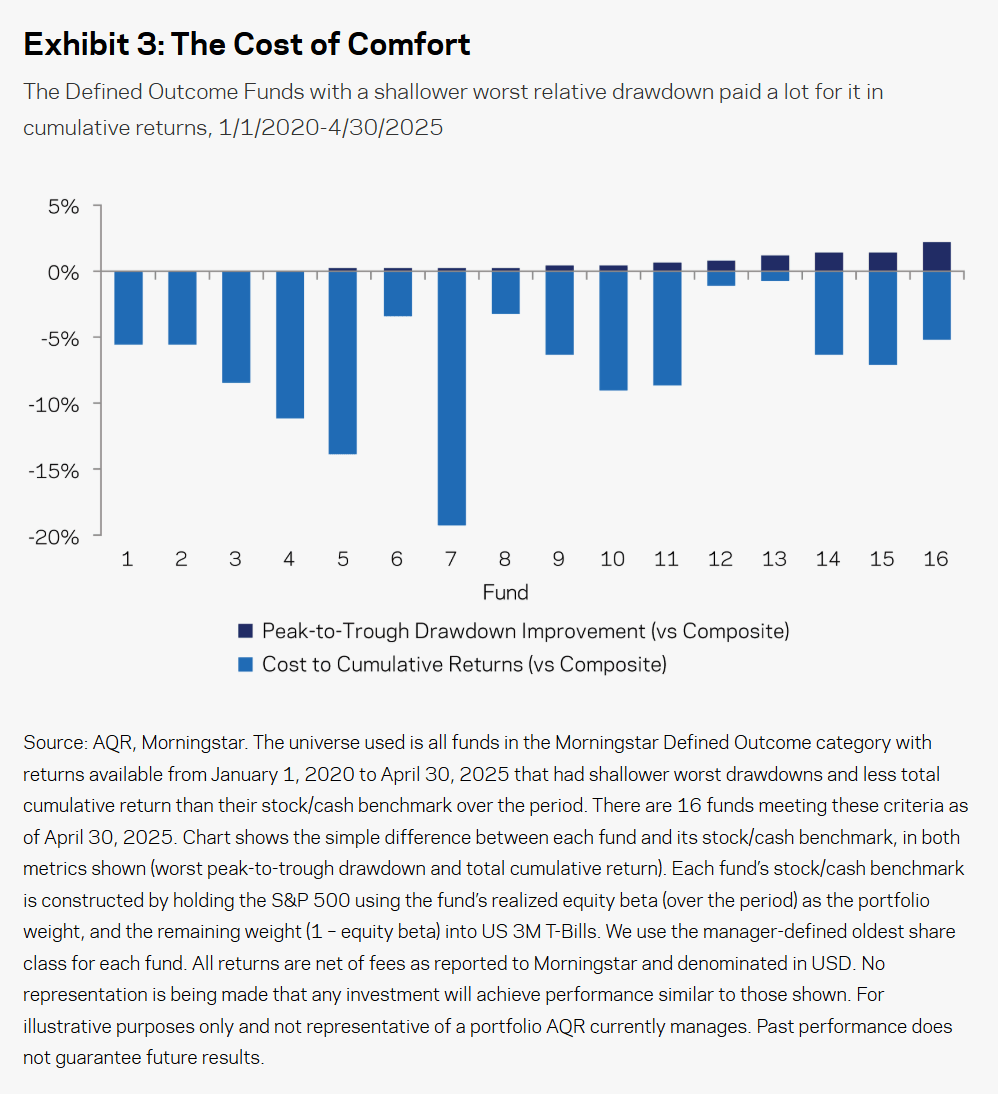
Cliff then zoomed into that 38% who has Worse return but Better drawdown.
There might be legitimate arguments that buffer strategies have a place. There are 16 funds here and we take a look at the funds individually.

The dark blue bars show the peak to through drawdown improvement, or how much better you can do versus the 70%/30% passive strategy. Like not a lot.
The lighter blue bars show the cost to you, in terms of returns forgo.
You can observe that you can forgo a fair bit of returns. I think Cliff’s point is we need to answer both question 1 and 2 together. When we consider both of them together, would such a buffer strategy still make sense.
If We Included More Data that is Earlier than 2020
There were people commenting that the data period of 2020 onwards was too short. If he were to start in 2015, he would only have 31 funds to test.

If Cliff included more data, the result would looked worse.
Performance of these Strategies Over the Turbulent 2025
Cliff showed the returns over this few months, which is a period where US equities were down, interest rates are higher than the past decade’s average, and volatility spiking to levels not seen since Covid).

75% (60% + 15%) have worse drawdowns.
What if we only focus on Defined Outcome funds:

Of the 42 funds in this data set, 83% (76% + 7%) have worse peak-to-through drawdowns than a 70% equity 30% US Treasury bill allocation.
We Can Learn About How Fluid the Caps and Effectiveness of Buffered Strategies By Observing BUFR
Morningstar Managing Director of Research Jeffrey Ptak did a profile of FT Vest Laddered Buffer ETF (BUFR) which allows us to gain insights on the actual behavior of how these risk assets with options protection work.
FT Vest basically created a fund of funds with a few of its Defined Outcome ETFs so that they will ladder in their options protection:
The investment objective of the FT Vest Laddered Buffer ETF is to seek to provide investors with capital appreciation. The Fund seeks to achieve its investment objective by providing investors with US large cap equity market exposure while limiting downside risk through a laddered portfolio of twelve FT Vest U.S. Equity Buffer ETFs (“Underlying ETFs”). Under normal market conditions the Fund will invest substantially all of its assets in the Underlying ETFs , which seek to provide investors with returns (before fees, expenses and taxes) that match the price return of the SPDR S&P 500 ETF Trust (“SPY”), up to a predetermined upside cap, while providing a buffer against the first 10% (before fees, expenses and taxes) of SPY losses. The buffer is only provided by the Underlying ETFs. The Fund itself does not provide any buffer against losses. The Fund simply seeks to provide diversified exposure to all the Underlying ETFs in a single investment. In order to understand the Fund’s strategy and risks, it is important to understand the strategies and risks of the Underlying ETFs.
BUFR is made up of the following ETFs:

Each ETFs sells a call and buy a put with one year to expiry which means they offer protection over a 1 year period. For example, the September one will offer protection from 19/9/24 to 19/9/25. Each ETF Caps the return at 13.7% and protects the first 10% of losses.
So how would the returns look like since the inception of the underlying? Jeffrey listed them down in the table below:

- ETF Month tells us which sub-buffer ETF funds we are talking about.
- The start and end tell us the date the period the options run and protect.
- Cap tells us that for that yearly sub-buffer, what is the CAP on returns.
- Buffer tells us the degree of protection. It is 9.15% instead of 10% because it factors in the Total Expense Ratio.
- ETF return shows us the return for the period
- SPY return shows us the price return (note its price not total return)
- Deepest intra-period drawdown shows that within that period, the lowest point, relative to the starting value of the sub-Buffer at the start of the period.
The ETFs are doing as it should if you compare the SPY return and the ETF return. During those 2022 periods, your SPY return can be -15% but the ETF return is -7%. The same in Feb 2025 where the return is -10% but the SPY return is -15%.
But you can see… the same SPY return, the outcome for the ETF is rather different (-7% vs -10%).
One thing to take note is also… the CAP keeps changing. The degree of protection is the same but the cost of protection keeps changing and so the CAP also keeps changing.
Further Considerations that Makes Buffered Strategies less Appealing.
Cliff explains some of the economic drivers underpinning the buffer strategies that makes the results this way. Rather than focus just on the results, we have to be rather clear about the “meta” of how these strategies work.
Firstly, if you are putting serious money to work, you better understand something about options if not I think you end up being surprised if the fund does not work according to your expectations. (It may not be the fund’s fault. It is your fault not understanding the alternate pathways to these things).
- These strategies are based on options. They need to keep buying put options for protection. That will drag the performance down over time, unless they fund it by the options premiums earned by selling call options. This is why the returns of these strategies are capped to the upside.
- Even if you are not looking long term but looking for short term protection, Cliff argues these funds don’t always work well. The reason is because options are meant to protect for a VERY SPECIFIC period but these strategies need to be more systematic and their way of protecting and funding is over a fixed period. All this may result in the market down but the options might not react and pay the fund accordingly.
- Options cost is also not cheap and does not stay the same. If these strategies become more and more popular, along with other reasons, then the cost of protection is higher but the premiums that you can earn from selling calls might not be correspondingly higher. What this usually means is that you need to sell more call options CLOSER to the current price to earn enough premiums to fund the puts. This means that the upside that you enjoy for the S&P 500 is LOWER. So your returns gets capped more and more. Your upside returns are just lower.
- People say the analysis missed the point that options provide convexity. Convexity means that the payoff of options is not linear. Linear metrics like market beta cannot evaluate inherently nonlinear, options-based strategies. Cliff gives a good answer. If options provide convexity and it works in such a strategy that leans more systematic, then the benefits of convexity should show up in some form. After all, this is why we apply options to equities isn’t it? To improve the outcome in a way we desired. But mostly it doesn’t show up.
Why Then Do People Find Buffer Strategies Appealing?
Cliff thinks this is the Placebo Effect:
In medical trials the classic placebo is a sugar pill – something that doesn’t have any therapeutic effectiveness, but which the patient is told is a real treatment. Even though the placebo is itself inert, some patients nonetheless claim it helps with their symptoms—the placebo effect.
You, the investor actually fear volatility, or losing a large chunk of your money.
So the financial representative or the media sells you this placebo.
You may pay more for it and feel good.
Then if we ask you to put in a balanced portfolio or conservative portfolio instead, that sounds so unsexy or unsophisticated.
I can see why people find these things appealing.
Kyith’s Final Take
Buffered funds eventually will have a certain returns and risk profile of a 60/40 or a 40/60 portfolio. This is kind of the same as a covered call or cash secured put ETF strategy in theory.
If so, this statement of mine… I think there aren’t much visible differences to that significant degree for me to tell you buffered strategies have their appeal.
Still rings true.
I think you should really ask what you want from such a Buffer Strategy solution if you know:
- The long term returns of this is going to be lower than the underlying equities exposure.
- The downside protection gives you some psychological relief in the short term.
The use-case is whether you use this or just a more fixed income heavy traditional allocation.
If you think the market is due for a crash, but you could be wrong, then there may be a role for this, but you are also not sure what will be the eventual outcome. I do think that there are times it will do better especially if fixed income does not do so well.
Which is one of the reason I think many people might eventually not stick with this.
Most of us have some expectation of an investment and eventually there are some reality.
And for the most part, the expectations are set by the investment brochure or the sales pitches. If you look at a lot of the evidence or how things actually played out, the buffered strategies does its job, but they don’t do it to such a degree that people have in their mind.
- The underlying returns are uncertain.
- The degree these protection works is uncertain.
- The Cap on returns also changes, which makes the upside of the returns uncertain.
So while it does its job, it ends up in an uncertain return and many will just see that the performance is worse than the S&P 500.
And that is their conclusion… and they eventually sell out.
Buffered strategies has to be invested and guided by people who understands what they are suppose to do, and whether they are suitable for you.
If not I think most will just conclude the wrong things.
What are your thoughts? Does solutions like this interest you?
If you want to trade these stocks I mentioned, you can open an account with Interactive Brokers. Interactive Brokers is the leading low-cost and efficient broker I use and trust to invest & trade my holdings in Singapore, the United States, London Stock Exchange and Hong Kong Stock Exchange. They allow you to trade stocks, ETFs, options, futures, forex, bonds and funds worldwide from a single integrated account.
You can read more about my thoughts about Interactive Brokers in this Interactive Brokers Deep Dive Series, starting with how to create & fund your Interactive Brokers account easily.
Kyith is the Owner and Sole Writer behind Investment Moats. Readers tune in to Investment Moats to learn and build stronger, firmer wealth foundations, how to have a Passive investment strategy, know more about investing in REITs and the nuts and bolts of Active Investing.
Readers also follow Kyith to learn how to plan well for Financial Security and Financial Independence.
Kyith worked as an IT operations engineer from 2004 to 2019. Currently, he works as a Senior Solutions Specialist in Insurance Start-up Havend. All opinions on Investment Moats are his own and does not represent the views of Providend.
You can view Kyith’s current portfolio here, which uses his Free Google Stock Portfolio Tracker.
His investment broker of choice is Interactive Brokers, which allows him to invest in securities from different exchanges all over the world, at very low commission rates, without custodian fees, near spot currency rates.
You can read more about Kyith here.


![Maynard Paton | [ShareScope] Screening For My Next Share Winner: GLOBALDATA](https://som2nynetwork.com/wp-content/themes/rehub-theme/images/default/noimage_336_220.png)
