
Against this environment it’s unlikely a UK early retiree who has opted for a higher withdrawal rate will be dancing for joy but let’s take a look.
This update of the drawdown demonstrations now has our retiree some 12.5 years in to retirement. It assumes our retiree is not one of the lucky ones sitting on a defined benefit pension (although it’s likely they’d need some other income source in the early years if they’re going to FIRE), isn’t intending to buy an annuity (again, not likely for the early years of FIRE) and isn’t planning on living off the State Pension (although 12.5 years in to retirement our UK retiree might just be starting to get to an age where there might be some predictability in what they might receive here so they might want to start baking a portion into their models).
We are now fast approaching the half way mark that the 4% rule is based upon and this simulation assumes retirement was taken on the 31 December 2006. If this date sounds convenient then you’re right. The date was deliberately chosen as it is the year prior to the commencement of the global financial crisis and so hopefully represents a modern worst case. Someday it may even go down in history as one of the time periods which saw a poor sequence of returns however of course that will only become clear when we are firmly looking in the rear view mirror many years hence.
Over the years readers have suggested various alternatives for these demonstration portfolios however for long term consistency I want to make as few changes to the original assumptions as possible so will stick with them for now.
Where we left our retiree’s a year ago can be found here. In brief, the key assumptions are:
- Our retiree’s are drawing down at the stated withdrawal rate plus fund expenses only. This means any trading commissions, wrapper fees (eg ISA, SIPP fees), buy/sell spreads and taxes have to be paid out of the earnings taken. For example, our 2% initial withdrawal rate retiree is actually drawing down at between 2.1% and 2.2% dependent on the asset allocation selected.
- 6 Simple UK equity / UK bond portfolios are simulated for our retiree. The UK equities portion is always the FTSE 100 where the iShares FTSE 100 ETF (ISF) is used as the proxy. This fund currently carries expenses of 0.07% however this has been as high as 0.4% in the past. For the bonds portion a simulation is run against UK gilts (FTSE Actuaries Government Securities UK Gilts All Stock Index) where the iShares FTSE UK All Stocks Gilt ETF (IGLT) is used as the proxy and the bond type I have preferred in my own portfolio, UK index linked gilts (Barclays UK Government Inflation-Linked Bond Index), where the iShares Barclays £ Index-Linked Gilts ETF (INXG) is used as the proxy. The later has seen it’s expenses reduced from 0.25% to 0.1% over the past year which should also give a little performance boost going forwards.
- All calculations are in real (RPI inflation adjusted) terms meaning that a £ in 2006 is equal to a £ today.
- The wealth accrued at retirement (the 31 December 2006) is £100,000. To simulate a larger or smaller amount of wealth just multiple by a constant. For example if you want our retiree’s to have £600,000 just multiply all the subsequent pound values by 6.
A 4% Initial Withdrawal Rate

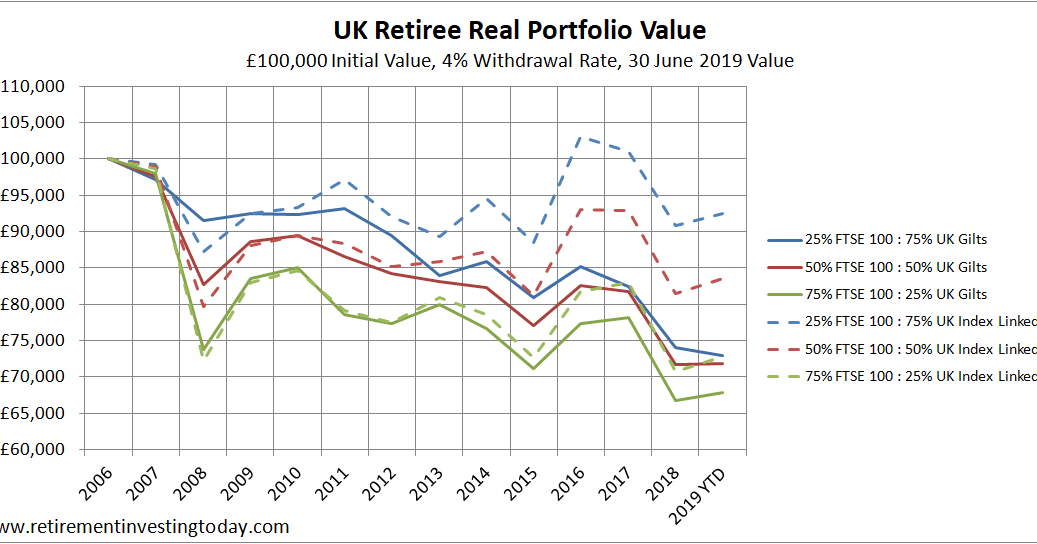
UK Retiree Real Portfolio Value, £100,000 Initial Value, 4% Withdrawal Rate, 30 June Value, Click to enlarge
I always start with a 4% withdrawal rate because of the often quoted 4% safe withdrawal rate rule. The 50% equity : 50% gilts portfolios (the red lines on the chart) are the closest representations to the 4% rule with obvious differences being that:
- the 4% rule was for a US based investor with US based investments while I’m simulating UK investors with UK based investments; and
- the 4% rule doesn’t consider fees where I’m capturing the OCF’s of the ETF’s which makes my withdrawal rate very slightly higher.
One year ago, after 11.5 years of retirement, between 7% and 28% of investment wealth had been lost in real terms. A year on the 75% FTSE 100 / 25% UK Gilts portfolio remains the worst performer, now down 32% in real terms, with the 25% FTSE 100 / 75% UK Index Linked Gilts remaining the best performer, now down 8%.
So we’re 42% of the way through a 30 year retirement and in the worst case scenario have burnt through 32% of our wealth in real inflation adjusted terms. I personally wouldn’t be sleeping overly soundly with this and for some time now probably would have scaled back spending a little if that option was available to me or I might have tried to work up some sort of part-time income. Those who are less risk averse would probably be rolling with the punches and maybe starting to assume some state pension will help things in the future.
A 3% Initial Withdrawal Rate

UK Retiree Real Portfolio Value, £100,000 Initial Value, 3% Withdrawal Rate, 30 June Value, Click to enlarge
A 3% withdrawal rate after the expenses of the ETF’s was chosen as it is very close to Wade Pfau’s research which for a UK investor with 50% UK stocks and 50% UK bonds showed that historically a safe withdrawal rate to not extinguish your wealth in a 30 year period was 3.05%.
Our 3% drawdown retirees, or £3,000 withdrawn per annum, which are loosely following Pfau’s simulation with 50% equity / 50% gilts portfolio’s are up 1% and 12% (last year up 2% and down 10%). Even for a 40 year retirement that’s not looking to bad to me.
Looking over the 6 portfolios the best case portfolio is now up in real terms by 10% while the worst is down by 16%. This is a slight degradation on one year ago which were at best up 9% while at worst were in the red wealth wise by 13%.
A 2.5% Initial Withdrawal Rate

UK Retiree Real Portfolio Value, £100,000 Initial Value, 2.5% Withdrawal Rate, 30 June Value, Click to enlarge
I’ve put this withdrawal rate in as it most closely represents the situation I have settled on, went into FIRE with and will reFIRE with. I’ve planned around a 2.5% withdrawal rate and a 40 year retirement.
My FIRE portfolio is now set. Against these demonstration portfolios asset allocation wise it sits almost midway between the 50% FTSE 100 / 50% UK Index Linked Gilts and the 75% FTSE 100 / 25% UK Index Linked Gilts. If these were my only asset classes and if I had have pulled the FIRE’ing pin back at the end of 2006 then in real terms my wealth would now be up around 4% in real terms. Ideally I’d like my wealth to not deplete in real terms, it’s one of the reasons I want to try and just live off dividends, so a 4% wealth gain would have me in a good place. I’m therefore still happy with a 2.5% plus investment expenses withdrawal rate.
A 2% Initial Withdrawal Rate

UK Retiree Real Portfolio Value, £100,000 Initial Value, 2% Withdrawal Rate, 30 June Value, Click to enlarge
This should be a very conservative drawdown rate which means it requires a lot of wealth to support. For example if you desire £20,000 of drawdown per annum then you’re going to need a cool £1,000,000. At this point that is also how it seems to be playing out with our retiree probably having worked too long before retiring. The worst portfolio is flat at 0% with the best now up 28% (was 24% last year) in real terms.
To Conclude
This demonstration looks at 24 different portfolio / drawdown rate combinations. Of those we now have 10 (was 11 last year) that are still in real inflation adjusted positive territory. Of the 14 that are in the red one is now down 32% but we’re also now fast approaching the half way mark of the much talked about 30 year drawdown period. That’s possibly fine for somebody taking a more traditional retirement but is far from long enough for somebody FIRE’ing very early. This study continually reinforces to me:
- the risks associated with living off capital; and
- that blindly following any mechanical safe withdrawal method could be a dangerous hobby.
On the positive side even if a Global Financial Crisis style event were to occur again my portfolio and assumptions might just be able to weather such a storm.
As always DYOR.


