
Stock Market Outlook entering the Week of April 13th = Downtrend
- ADX Directional Indicators: Downtrend
- Institutional Activity (Price & Volume): Downtrend
- On Balance Volume Indicator: Downtrend
ANALYSIS
The stock market outlook remains in a downtrend after another historic week for U.S. equities.
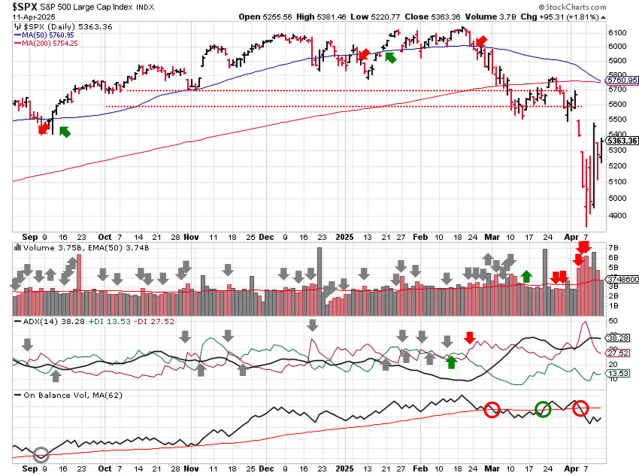
After ALL THAT, the S&P500 ( $SPX ) rose 5.7%. The index sits ~7% below the 50-day moving average and ~7% below the 200-day moving average. The index filled one of the gaps mentioned last week ( 5300 to 5400 ); the other one ( 5500 to 5600 ) remains unfilled.

SPX Price & Volume Chart for Apr 13 2025
All three technical indicators ( ADX, OBV, and Institutional Activity ) remains in bearish territory. No surprises here.

S&P Sector Performance for Week 16 of 2025
Almost all sectors recovered some ground last week, with the Tech sector leading the way. Real Estate fell just shy of break even. Consumer Staples shifted back to Neutral bias; all the other sectors remain bearish.

Sector Style Performance for Week 16 of 2025
All sector styles registered a gain last week, with Momentum scoring the largest gain. No changes in bias; all styles remain bearish.

Asset Class Performance for Week 16 2025
Gold ( $GLD ) was the best asset last week, though equities weren’t far behind. Bonds ( $IEF ) and the dollar were the worst asset classes. Bonds also shifted to a bearish bias due to the recent rise in rates.
COMMENTARY
Another wild week for financial markets is in the books. Given the level of uncertainty around outcomes from the new U.S. tariff regime and diplomacy by social media, expect the volatility to continue.
Lost in the noise was improved inflation data. Headline and Core CPI came in lower than expectations, which was welcome news for those hoping for rate cuts at the next FOMC meeting.
| CPI (y/y) | Actual | Prior |
Expected |
| Headline | +2.4% | +2.8% | +2.6% |
| Core | +2.8% | +3.1% | +3.0% |
March producer prices (PPI) were also lower in March.
| PPI (y/y) | Actual | Prior |
Expected |
| Headline | +2.7% | +3.2% | +3.3% |
| Core | +3.3% | +3.5%* | +3.6% |
The first set of bank earnings beat expectations, but their outlooks didn’t instill a lot of confidence about the rest of the year. Long range planning requires some level of certainty, and the “price” of waiting 90 days is much lower than the cost of a strategic misstep.
It’s a complex system at work, which means there many “unintended” or “unanticipated” reactions that will catch investors off guard. Rather than try to predict what will happen, watch for more constructive price action: the return of bullish biases, stocks breaking out of solid bases with higher volume, $VIX
Best to Your Week!
P.S. If you find this research helpful, please tell a friend.
If you don’t, tell an enemy.


