
Stock Market Outlook entering the Week of March 16th = Downtrend
- ADX Directional Indicators: Downtrend
- Institutional Activity (Price & Volume): Downtrend
- On Balance Volume Indicator: Downtrend
ANALYSIS
The stock market outlook remains in a downtrend after another failed rally attempt.
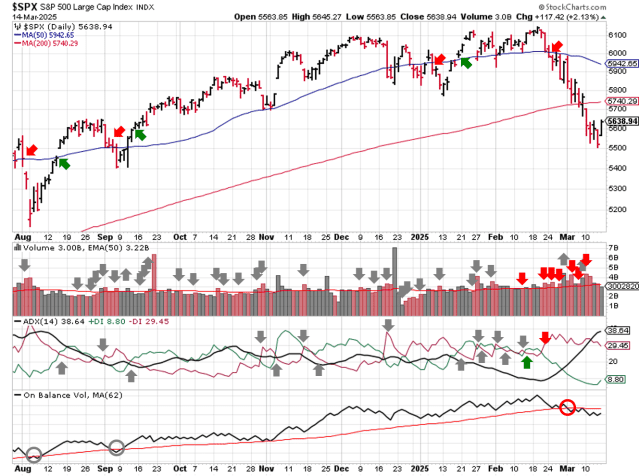
The S&P500 ( $SPX ) fell 3.1% last week and tested the 200 day moving average. The index is ~5% below the 50-day moving average and ~2% above the 200-day moving average.

SPX Price & Volume Chart for Mar 16 2025
All three indicators remained bearish. Another week, another failed rally attempt, as institutions weren’t in a buying mood and used the 3/7 rally attempt as another exit opportunity. Sticking to the script, the market put in another potential rally start on Friday, although this time the trading volume was low.

S&P Sector Performance for Week 12 of 2025
Energy ( $XLE ) and Utilities ( $XLU ) were the only green sectors last week. Discretionary ( $XLY ) was the worst sector. The bias for Communications ( $XLC ), Staples ( $XLP ), and Materials ( $XLB ) moved to bearish, Real Estate ( $XLRE ) moved to Neutral. Energy ( $XLE ) and Utilities ( $XLU ) moved back to bullish.

Sector Style Performance for Week 12 of 2025
No winners across the sector styles last week; Defensive led to the downside with a drop of 3%. Large-cap value ( $IWX ) and Defensive ( $POWA ) moved to bearish bias.

Asset Class Performance for Week 12 2025
Gold led to the upside last week, continuing its recent run atop the leaderboard. Bitcoin and US equities were the worst performers. Dollar met resistance, shifting back to bearish bias from neutral.
COMMENTARY
Economic data didn’t ring any alarm bells last week. January JOLTs was up slightly versus December. February inflation data easing from a year over year perspective. Headline and core consumer price index ( CPI ) fell 20 basis points.
| CPI (y/y) | Actual | Prior |
Expected |
| Headline | +2.8% | +3.0% | +2.9% |
| Core | +3.1% | +3.3% | +3.2% |
Producer prices ( PPI ) fell more than CPI, with Headline and Core PPI down 0.5% and 0.4%, respectively, thanks to upward revisions to January data (+0.2%).
| PPI (y/y) | Actual | Prior |
Expected |
| Headline | +3.2% | +3.7%* | +3.3% |
| Core | +3.4% | +3.8%* | +3.5% |
This week is likely to continue to trend of higher volatility, with retails sales, housing data, and another FOMC interest rate decision, not to mention any additional tariff talk.
Last weeks price action looks to be a consolidation of the recent sell off, which could turn into a near term bottom. But volatility is still elevated ( i.e. >20 ), and most sectors and styles are bearish bias, so positive price action has a higher probability of being a counter-trend rally than the start of a new trend. Either way, the ADX should turn around first, and we’ll need to see confirmation of Friday’s rally attempt sometime after Wednesday this week.
Best to Your Week!
P.S. If you find this research helpful, please tell a friend.
If you don’t, tell an enemy.