by Scott Ronalds
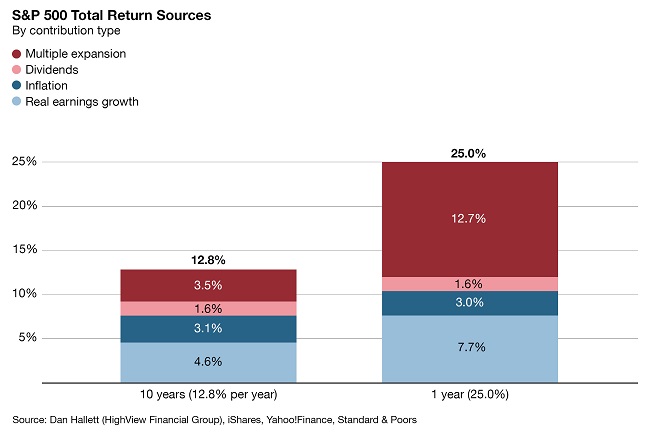
The Globe and Mail recently asked dozens of experts, including investors, economists, and business leaders, to choose a chart they think will be important to watch this year. Steadyhand Chair Tom Bradley was one of those asked for a submission. His choice, which was created with the assistance of industry veteran Dan Hallett, was published on the Globe’s website and is reproduced below, along with Tom’s comments.

Stock returns come from three sources: dividends, earnings growth and changes in valuation. The first two are reasonably steady over time, but valuations can swing wildly and are the main reason why markets are so volatile. The overall valuation of the market can be a detractor at times (as in 2022) or a big contributor, as it was over the past two years. The makeup of the 2024 S&P 500 Index return is typical of a good year. Dividends delivered and corporate earnings growth (after inflation) was excellent, but returns were overwhelmingly driven by expanding price-to-earnings multiples.
The makeup of the S&P 500’s 10-year return, however, is more unusual. Normally, periods of multiple expansion are offset by periods of contraction such that changes in valuation net out to zero in the return equation. To have valuation contributing 3.5% per year over a decade indicates that it’s been an unusually good ride. As investors enter 2025, they need to keep expectations in check, particularly when it comes to U.S. stocks. The next decade is unlikely to have the same valuation turbo boost as the last one did.
We’re not a bank.
Which means we don’t have to communicate like one (phew!). Sign up for our Newsletter and Blog and join the thousands of other Canadians who appreciate the straight goods on investing.

