

If you predicted that tech stacks would shrink in 2024, it was probably a good bet.
After all, the trend line had been headed in that direction. The average number of apps in companies’ stacks shrank in both 2022 and 2023, albeit by only a modest amount, less than 10% on average. But economic times were tight last year, and CFOs were on the warpath to cut SaaS waste. And, of course, there’s the ongoing 10-year narrative that the whole SaaS industry, martech especially, has been ripe for consolidation.
So betting on red — shrinking SaaS stacks — would have seemed a safe wager.
However, if you made that bet, I’m sorry to say, you lost.
The latest SaaS Management Index Report was just released by Zylo, a leading SaaS management platform that manages over 40 million SaaS licenses and $40+ billion in SaaS spend. It’s based on hard, empirical data of tracked SaaS expenses, not squishy surveys where people guess — always way off — how much SaaS they think they have.
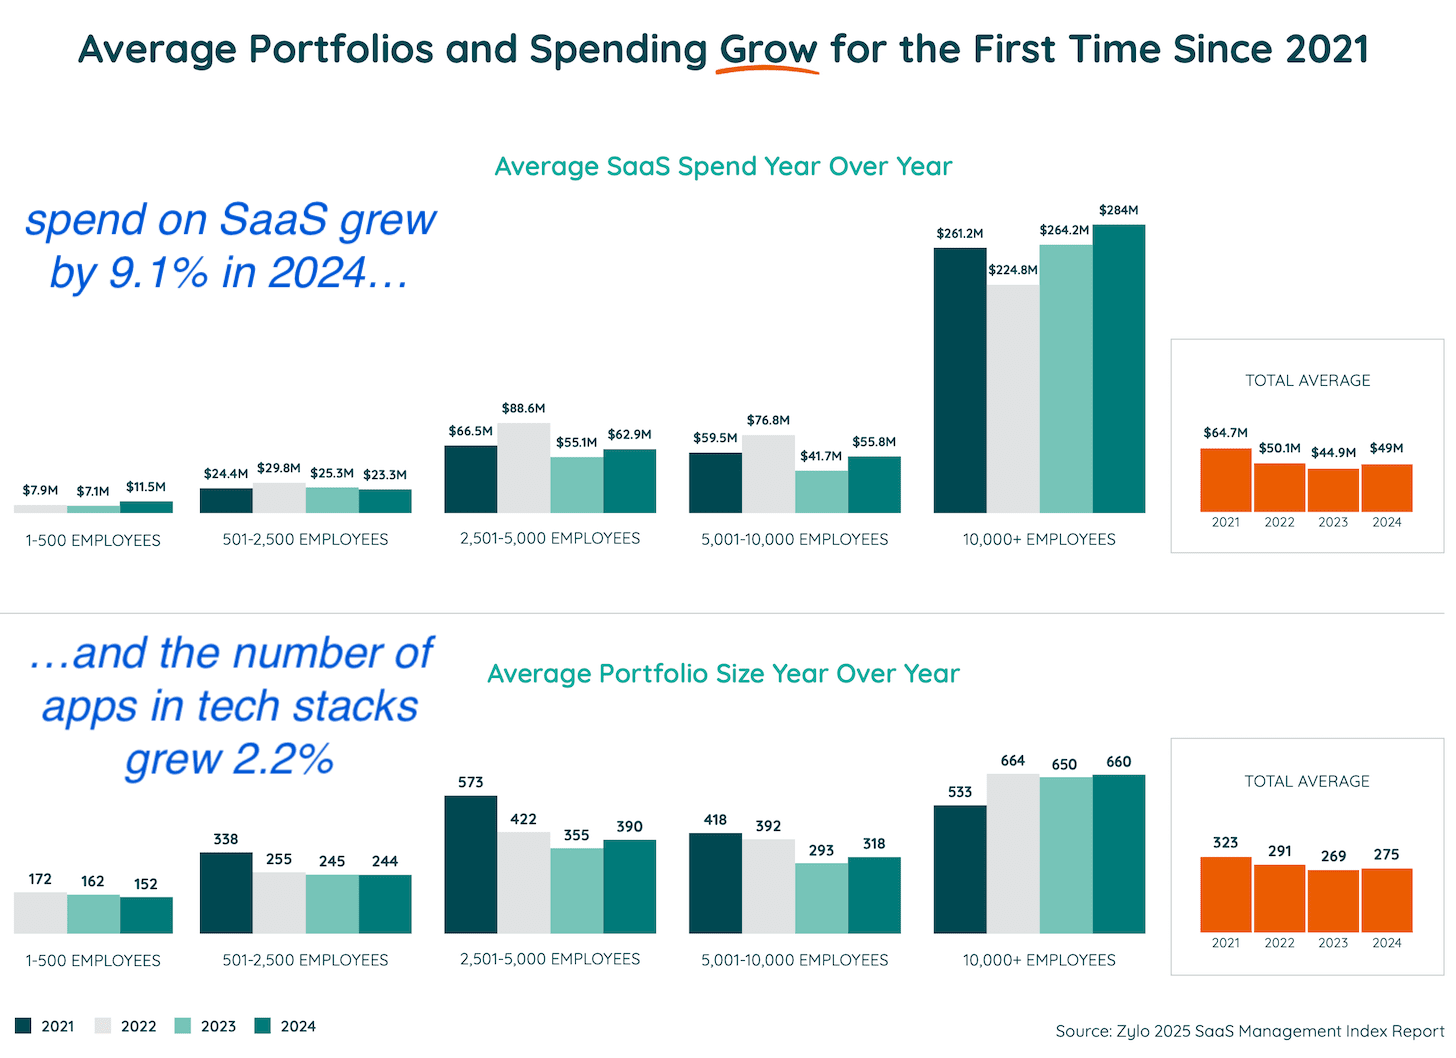
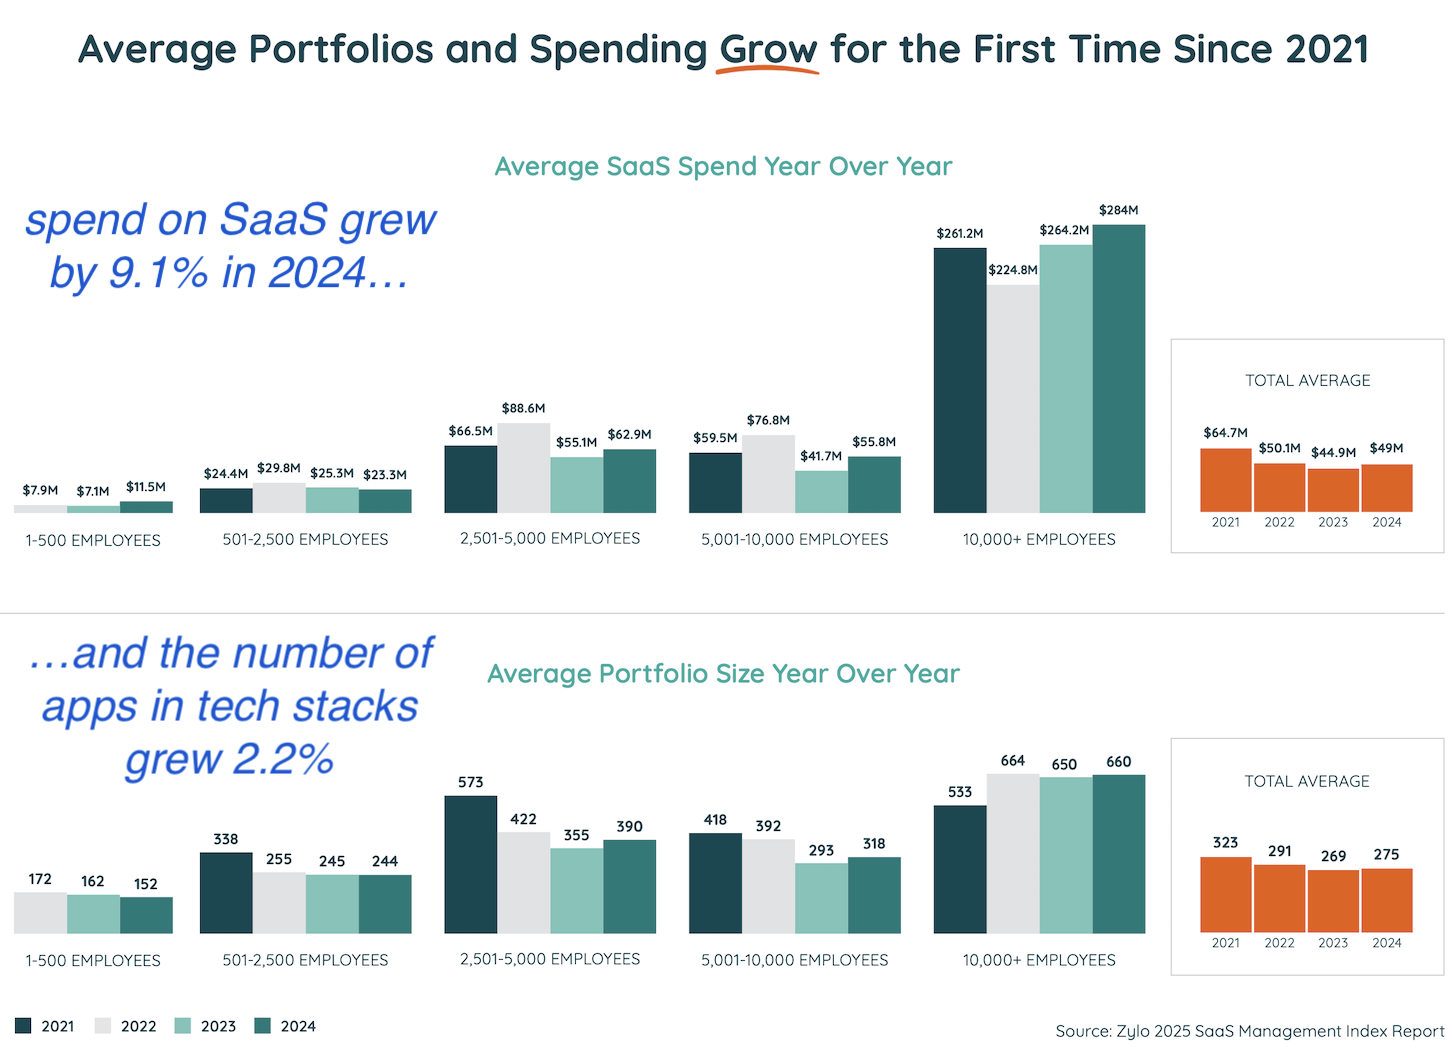
According to the data, the average number of SaaS apps in stacks grew by 2.2% in 2024.
Now, I know, 2.2% isn’t exactly runaway growth. And there were mitigating factors — cough, AI, cough — that countered underlying dynamics of SaaS consolidation. But hasn’t that been the story now for, what, 14 years? Tech keeps consolidating… except for all the new tech that keeps flowing in.
Spend on SaaS in 2024 grew even more, by 9.1%. This was in no small part due to many SaaS vendors raising their prices — a privilege, which buyers should note with irony, often accorded to more consolidated vendors. Be careful what you wish for. But clearly there was enough reason for companies, even under the close watch of the CFO, to not significantly shrink stack size or spend.
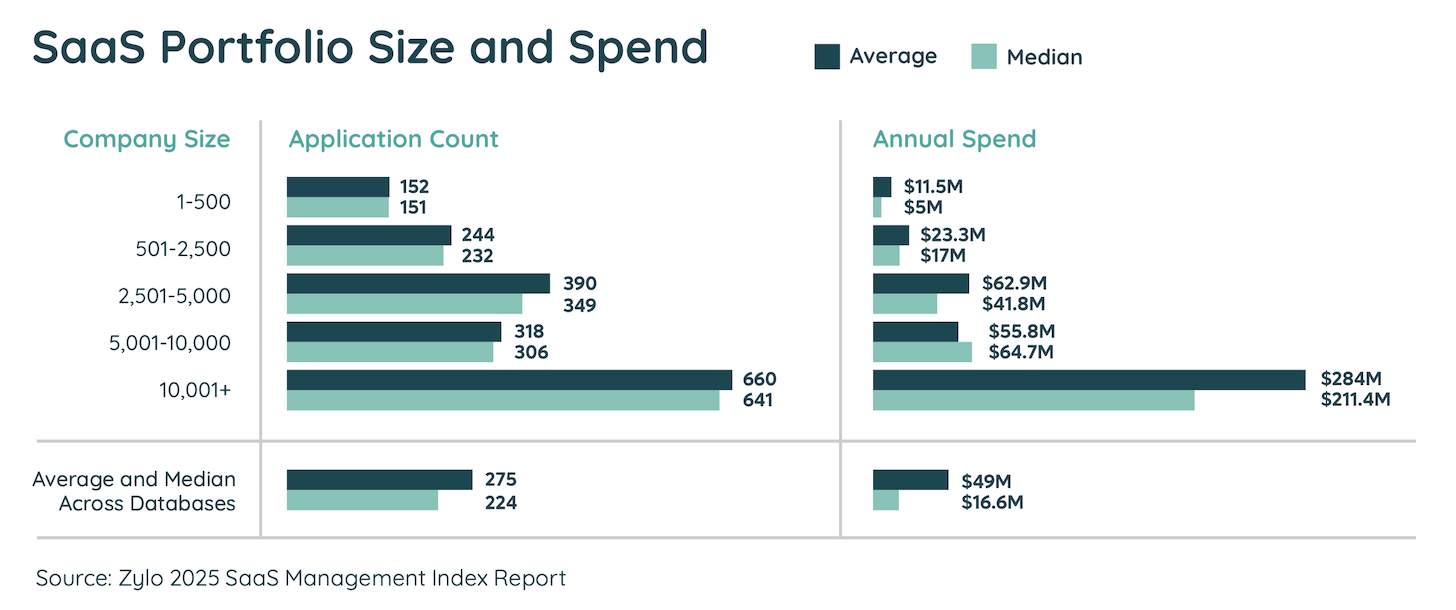
One thing Zylo did this year, which I really appreciate, is distinguish between the mean and median averages of stack size and spend:


As you’d might expect, the medians are lower than the means. We know some companies just have really sprawling tech stacks, which pull up the mean. The median better reflects the real “average” company. That said, it’s interesting to note that the medians aren’t that much lower than the means. So it’s a pretty solid conclusion that sizable SaaS stacks are not outliers, but reflective of reality for most organizations.
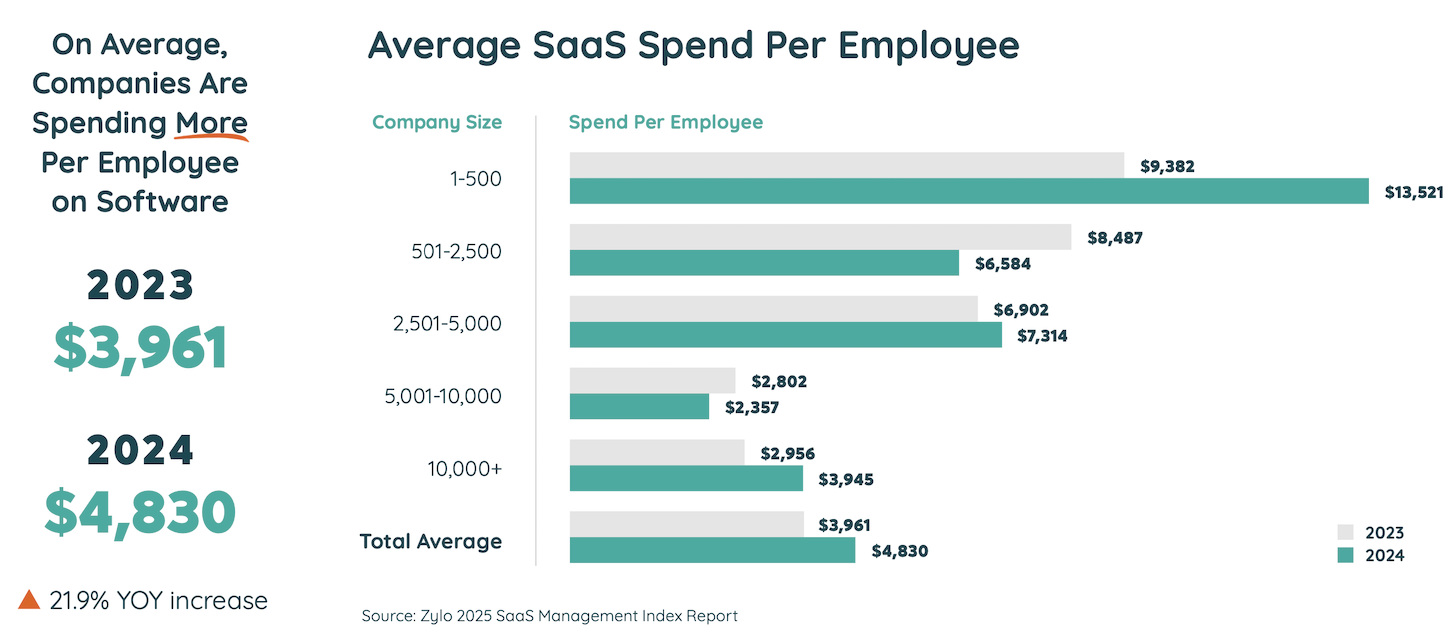
Another interesting stat: average SaaS spend per employee grew 21.9%.


Doing the math, if spend-per-employee grew more than 2X as much as overall SaaS spend, then the denominator — the number of employees — must be shrinking without a corresponding drop in software investments. This is most pronounced in the SMB segment of companies with 1-500 employees, which reported a whopping 44.1% increase in SaaS spend-per-employee.
While it’s too early attribute to this primarily to AI, it is the overall narrative of our time: the ratio of software to humans in business operations is increasing. And will increase more, and more, and more. It’s showing up sooner in SMBs because this segment includes many new digital-native startups, and SMBs are generally more agile and less risk averse than enterprises. They’re leveraging software to their financial advantage. And in this new wave of AI disruption, that could prove to be a pretty big advantage.
Sam Altman’s vision of a 1-person, $1 billion company would be the extreme incarnation.
But coming back to present day Earth, let’s look at another major trend solidified in Zylo’s report. Who owns all these apps populating the stack: IT, business units, or “shadow IT” (in this context is employees who buy software on their credit cards and expense it)?


The answer is pretty definitive: business units/departments. They own the majority of apps (50.5%) and pay for the vast majority of spend (70%). This trend has been steadily growing for the past three years.
That’s probably not a surprise to those of you in marketing reading this. So much of the software we’re using today is specific to our work. See the martech landscape. It makes sense that we should select, pay for, operate, and be accountable for it because it’s so deeply entwined in our craft and operations.
IT still controls 26.1% of all software spend, albeit for a small percentage of apps (15.9%). This makes sense, as IT should own software that spans multiple business departments. That’s typically a smaller number of apps, and mostly larger platforms and infrastructure. While I shy away from making predictions, my guess is that the share of spend under IT will increase over the next couple of years as more cross-org technologies gain momentum, especially at the data layer and with general-purpose AI platforms.
As a percentage of apps in the stack, shadow IT remains a solid 33.6%. The stack police have been able to shave a point or so off every year for the past 4 years, but it’s been hard to budge to any significant degree. People like their apps.
However, for all but the most obsessive finance folks, shadow IT remains a rounding error of a mere 3% or 4% of software spend. The CISO may have a more legitimate beef about the security and privacy risks.
Even then, if you look at the Top 10 apps that are most commonly expensed as shadow IT, they are: Udemy, ChatGPT, Canva, Kudoboard, CliftonStrengths, LinkedIn, OpenAI API, Grammarly, Adobe Acrobat, and Kahoot. With the exception of ChatGPT and OpenAI API — which should not be left ungoverned — most of these seem relatively low risk. Ideally, they should still be governed. But there are probably bigger fish to fry.
Anyway, I have barely scratched the surface of the wealth of data-validated insights about tech stacks in the Zylo report. I would highly recommend picking up a copy.
It’s going to be a fascinating year ahead. Any guesses as to what tech stacks will look like by January 2026?


