

🏘🍕 What are the best pizza cities in the U.S.? 🍕🏘
Rochester, New York, is America’s top pizza city for 2025, with a Pizza Passion Score of 98 out of 100 and more than 2x as many pizza restaurants per 100,000 residents as average (25 vs. 12.4 overall). It beat out better-known options like No. 8 New York City and No. 10 Chicago.
Ranking 100 American Cities for Pizza | Top 20 Cities for Pizza in the U.S. | Best States for Pizza | How Much Americans Love Pizza | Top Pizza Styles | Rankings by Category | Methodology | FAQ
Local pizza styles and trends can be like accents. Often, they can help immediately identify something’s origin but sometimes be strange or even incomprehensible to outsiders.
From city to city and region to region, what you’ll find in the box when you order a pizza can vary quite a bit, from New York’s large, foldable slices to Chicago’s saucy deep dish and even more far-out versions like Colorado-style (served with honey), St. Louis-style (known for a thin, cracker crust), and Ohio Valley-style (with cold, uncooked shredded mozzarella added before serving).
Setting aside regional loyalties and personal biases, we once again set out to find America’s best pizza city, a spot Denver won in 2024 after two consecutive titles for Detroit in 2022 and 2023.
This year, Clever Real Estate evaluated 100 of America’s largest cities on factors including:
- The number of pizza restaurants per capita.
- The average price of large cheese and pepperoni pizzas on thousands of pizzeria menus (and how they compare to local incomes).
- Clever’s Pizza Passion Score, which reflects Google searches related to pizza in various markets.
- A city’s perceived pizza quality, as measured by a poll of 2,000 Americans.
After crunching the numbers, a new champion came out on top as the best pizza city in the United States for 2025.
Rochester, New York, secured its spot as the Pizza Capital of America as a result of one of the highest Pizza Passion Scores (98 out of 100), a high number of pizza restaurants per capita (25 per 100,000 residents), and high average Yelp ratings for pizzerias (4.11 out of 5).
Respondents also chose New York State as their top pizza state, with 77% saying it’s a top-five pizza state compared to 56% for Illinois and 45% for California.
No. 2 Philadelphia and No. 3 Boston also take spots on the pizza podium, as Northeastern cities dominate the top 10 with eight spots overall. Only one Southern city ranked in the top 20, Washington, D.C., which is tied for No. 17.
Keep reading to see where other top cities landed and why, as well as revealing survey results that show just how much Americans love pizza — including how many are willing to relocate to a better pizza city.
🏙🍕 Best Pizza Cities in the U.S. Statistics
- The best city in America for pizza is Rochester, New York, with a Pizza Passion Score of 98 out of 100 and more than 2x as many pizza restaurants per 100,000 residents as average (25 vs. 12.4, respectively)
- Nine of the top 20 pizza cities in the U.S. are in the Northeast, with six in the West, four in the Midwest, and just one in the South.
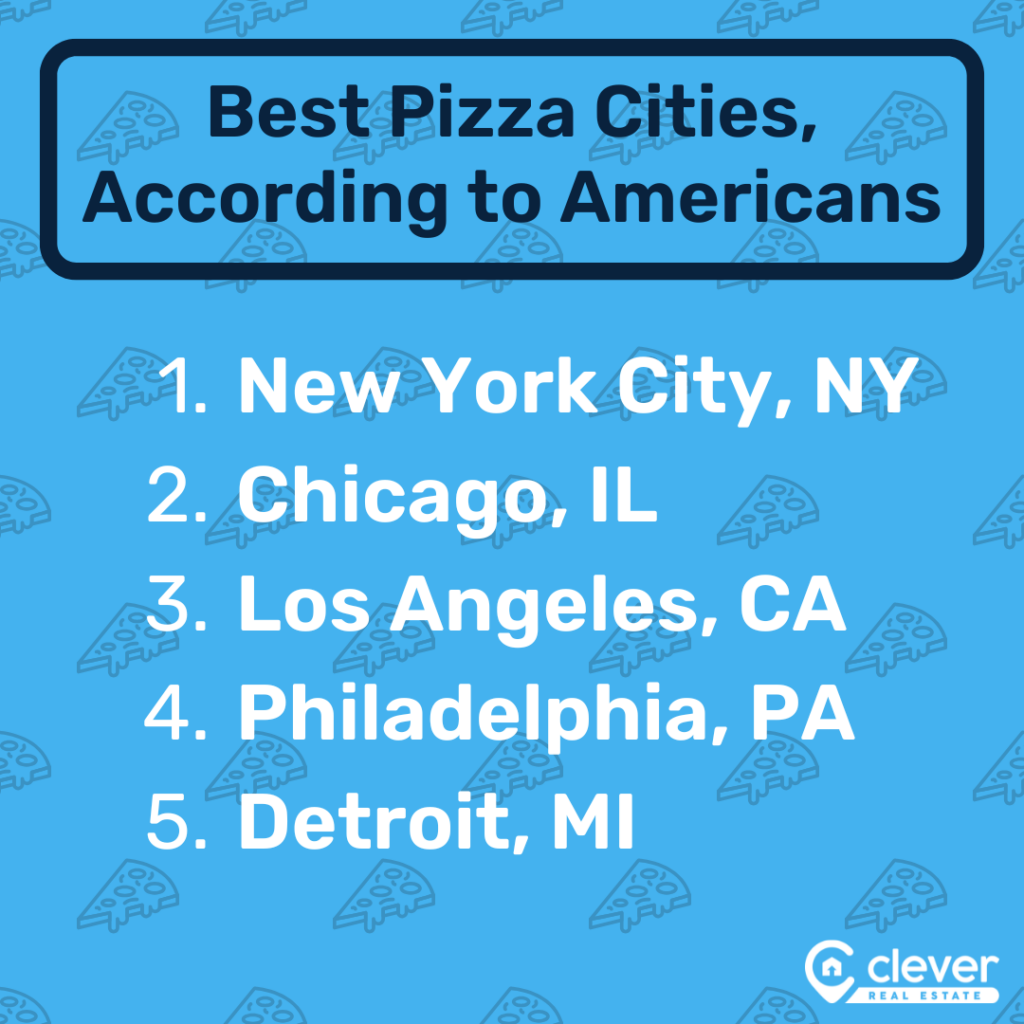
- When asked to name their top five pizza cities, Americans most frequently selected New York (66%), Chicago (57%), Los Angeles (22%), Philadelphia (17%), and Detroit (16%).
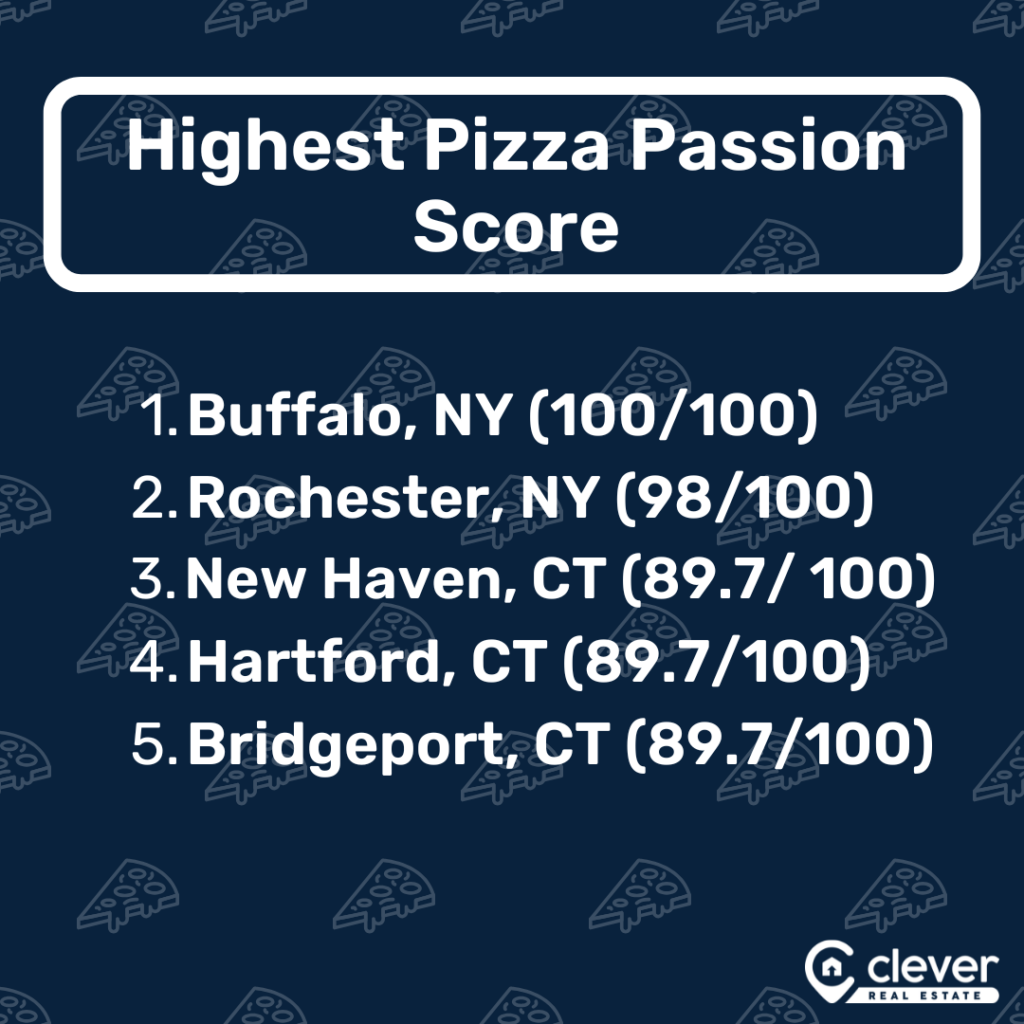
- Buffalo, New York, has America’s highest Pizza Passion Score (a perfect 100).
- Pizza restaurants in San Diego have the highest average Yelp rating, 4.35 out of 5 stars.
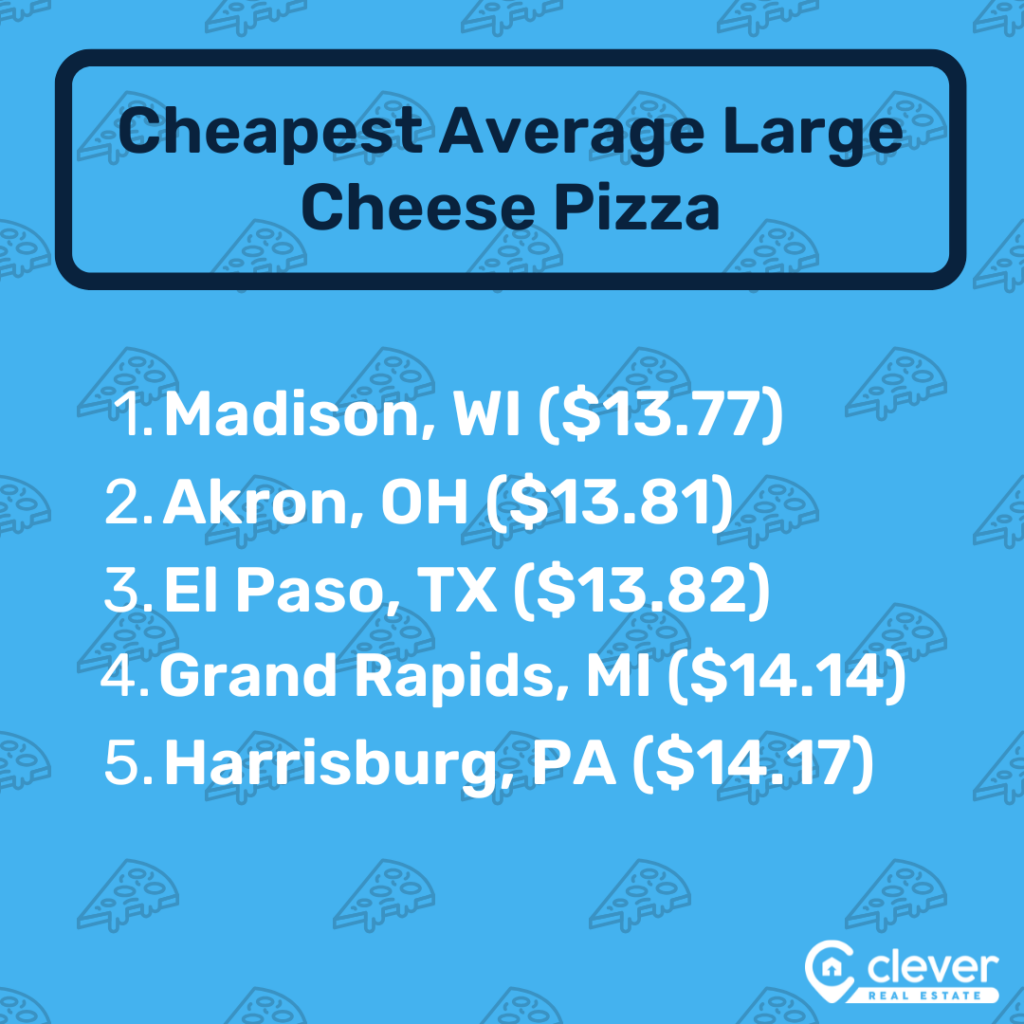
- The cheapest average large cheese pizza in the U.S. can be found in Madison, Wisconsin ($13.77), while the cheapest average large pepperoni pizza is sold in El Paso, Texas ($15.40).
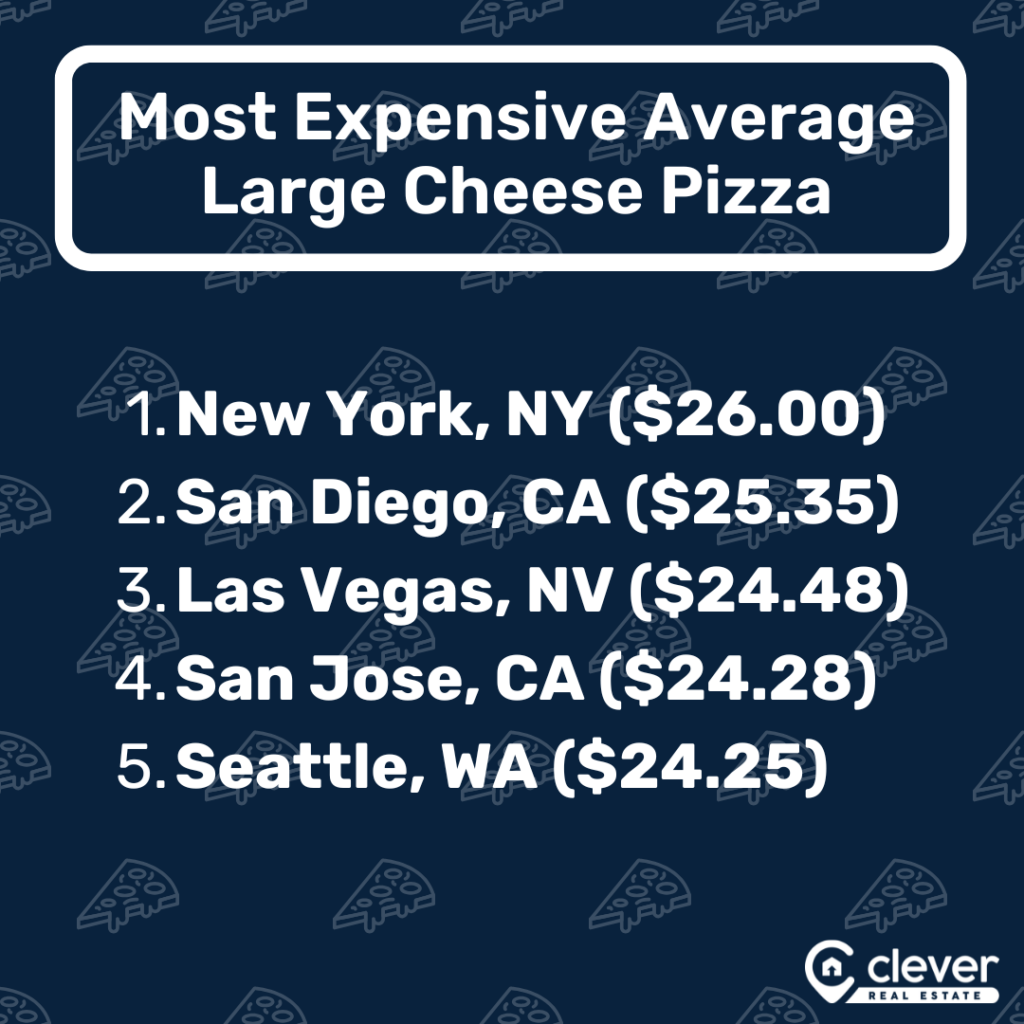
- On the flip side, New York City has America’s most expensive average large cheese pizza ($26.00) and pepperoni pizza ($29.75), a major factor in its No. 8 ranking.
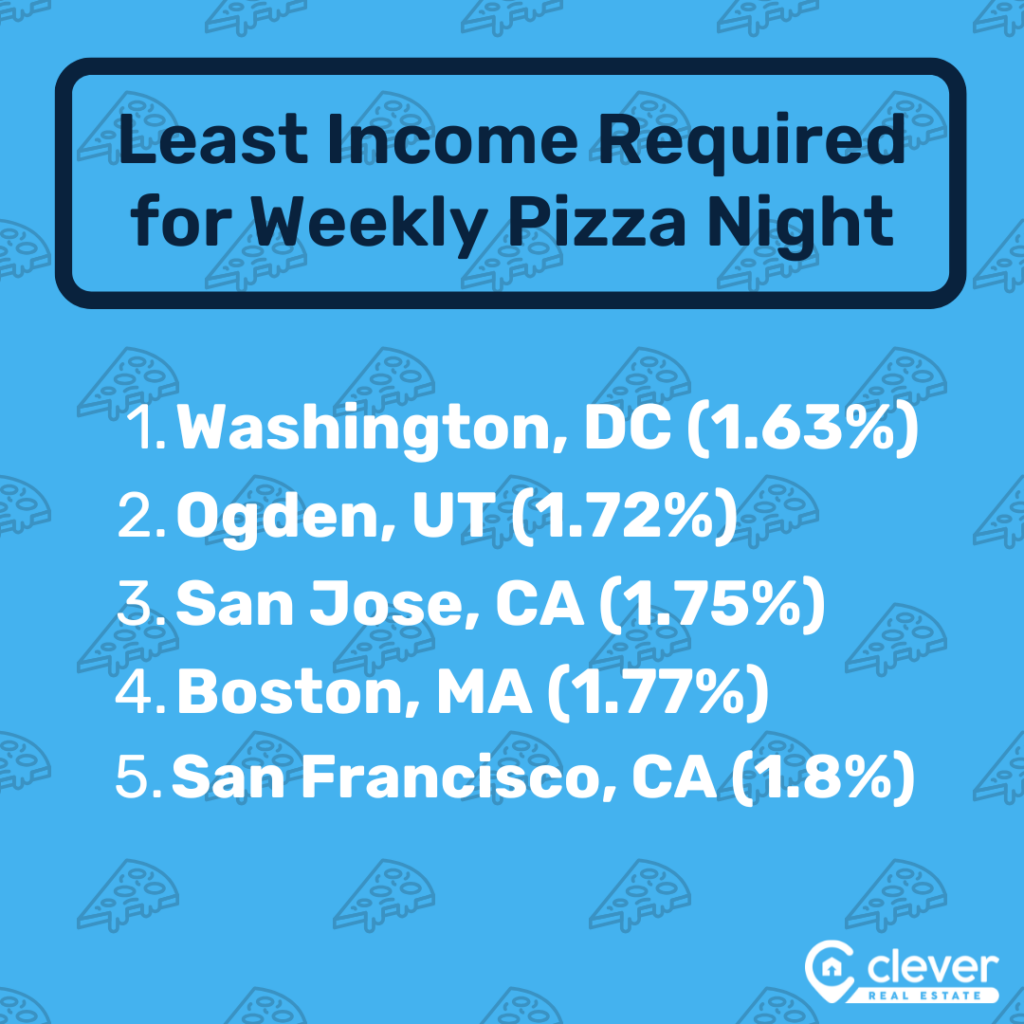
- A weekly pizza night with one large cheese and one large pepperoni pizza costs the smallest portion of the local median household income in Washington, D.C.: 1.63%.
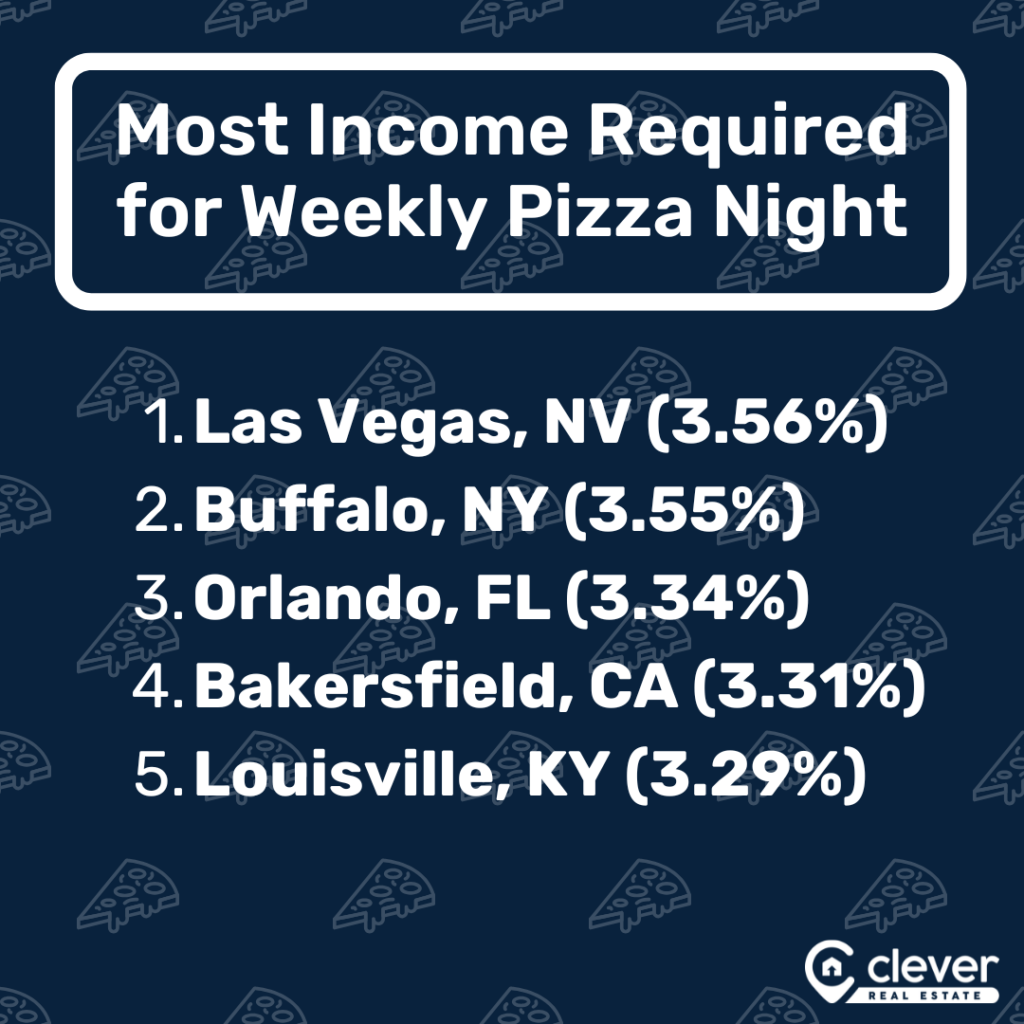
- A weekly pizza night is the priciest in Las Vegas, at 3.56% of the local income.
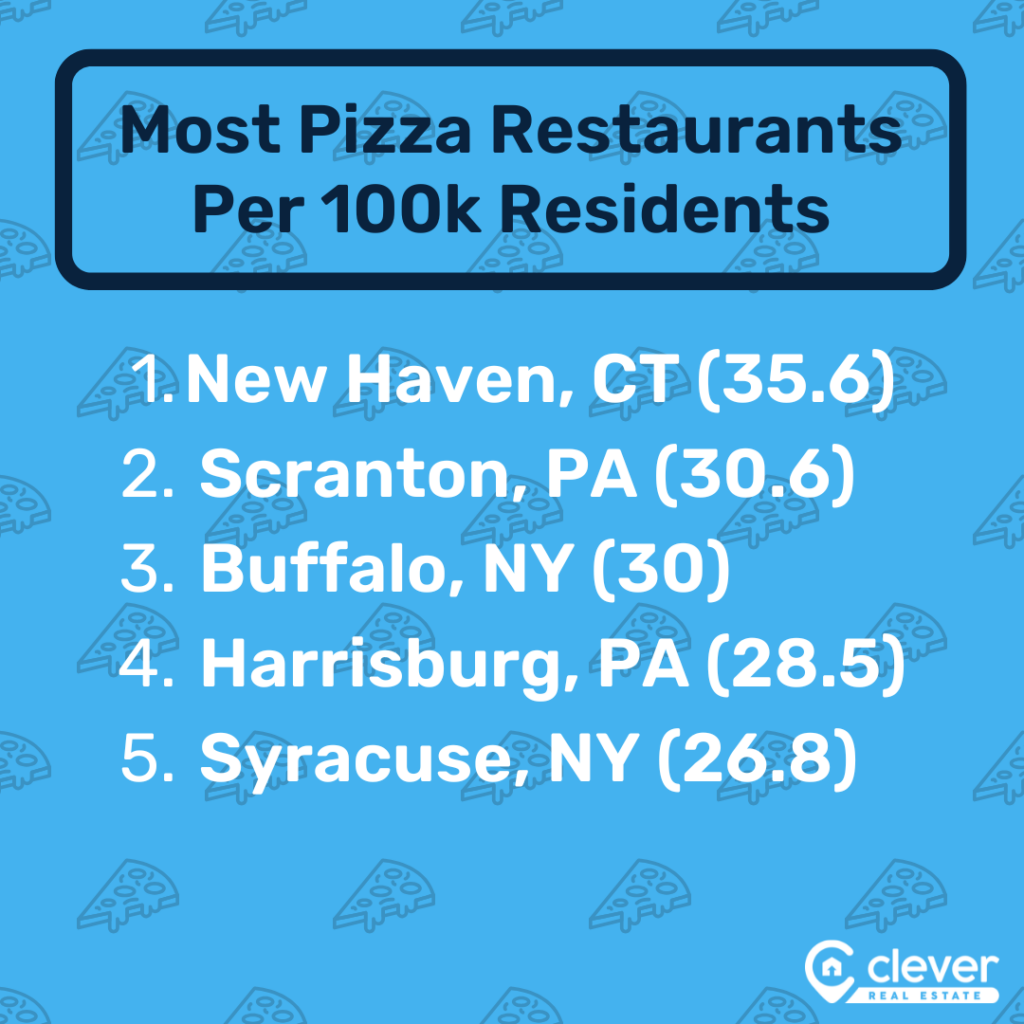
- New Haven, Connecticut, has the most pizza restaurants per capita, with 35.6 per 100,000 residents.
- However, New York City has the most pizza restaurants overall.
- More Americans love New York-style pizza (51%) than any other, followed by Chicago-style (40%) and Sicilian and Neapolitan, tied at 36% each.
- America’s most hated style of pizza is clam pizza, which only 16% have any positive feelings toward.
- Detroit-style pizza stands out, with 5x as many Americans who say they hadn’t heard of it wanting to try it (20%) than not wanting to (4%).
- Approximately 59% of Americans say pizza is their favorite food.
- The vast majority (87%) say they prefer to get it from small, independent pizza places over large chains.
- Over a third of Americans (35%) say the presence of a popular, iconic pizza restaurant would make them more likely to consider moving to a specific neighborhood, and the same percentage (35%) would even consider moving to a city with better pizza.
- A majority (58%) believe living close to popular restaurants, including pizzerias, increases property values, while 1 in 4 (25%) say they’d pay more for a home closer to well-known pizza places.
The 100 Best Pizza Cities in the U.S., Ranked
| Rank | City | Overall Score | Reputation Ranking From Survey | Pizza Passion Score* | Pizza Restaurants per 100,000 Residents | Average Yelp Rating | Avg Large Cheese Pizza | Avg Large Pepperoni Pizza | Percentage of Income Spent on Weekly Pizza Night** |
| – | National Average | – | – | 68.3 | 12.4 | 3.93 | $18.02 | $20.42 | 2.51% |
| 1 | Rochester, NY | 100.0 | 12 | 98.0 | 25.0 | 4.11 | $17.04 | $19.41 | 2.59% |
| 2 | Philadelphia, PA | 98.9 | 4 | 76.3 | 13.8 | 4.19 | $17.17 | $20.08 | 2.23% |
| 3 | Boston, MA | 97.7 | 7 | 80.4 | 13.5 | 4.09 | $17.53 | $20.25 | 1.77% |
| 4 | Detroit, MI | 97.4 | 5 | 80.6 | 6.8 | 3.98 | $16.25 | $17.86 | 2.44% |
| 4 | Buffalo, NY | 97.4 | 6 | 100.0 | 30.0 | 3.99 | $22.31 | $25.39 | 3.55% |
| 6 | New Haven, CT | 96.7 | 10 | 89.7 | 35.6 | 4.08 | $19.42 | $23.95 | 2.79% |
| 7 | Pittsburgh, PA | 96.6 | 17 | 87.6 | 17.4 | 3.99 | $15.94 | $17.86 | 2.42% |
| 8 | New York, NY | 95.5 | 1 | 68.5 | 12.3 | 4.19 | $26.00 | $29.75 | 3.04% |
| 9 | Albany, NY | 94.8 | 15 | 89.6 | 20.9 | 3.81 | $16.37 | $18.54 | 2.20% |
| 10 | Chicago, IL | 94.7 | 2 | 83.1 | 6.0 | 3.98 | $22.73 | $26.10 | 2.92% |
| 11 | Syracuse, NY | 94.6 | 13 | 82.7 | 26.8 | 3.87 | $16.60 | $19.00 | 2.53% |
| 12 | Los Angeles, CA | 94.2 | 3 | 58.5 | 5.0 | 4.30 | $23.44 | $27.53 | 2.88% |
| 13 | Las Vegas, NV | 94.1 | 9 | 68.2 | 19.3 | 4.19 | $24.48 | $26.91 | 3.56% |
| 14 | San Francisco, CA | 94.0 | 8 | 54.4 | 12.2 | 4.31 | $20.79 | $23.44 | 1.80% |
| 15 | Milwaukee, WI | 93.5 | 14 | 76.3 | 13.4 | 4.08 | $18.46 | $21.73 | 2.71% |
| 16 | Phoenix, AZ | 93.3 | 24 | 64.6 | 4.6 | 4.25 | $16.83 | $19.46 | 2.20% |
| 17 | Washington, DC | 93.1 | 21 | 66.8 | 8.4 | 4.14 | $17.80 | $20.31 | 1.63% |
| 17 | St. Louis, MO | 93.1 | 27 | 79.4 | 7.3 | 4.20 | $18.03 | $20.40 | 2.55% |
| 19 | Denver, CO | 93.0 | 20 | 67.1 | 10.5 | 4.22 | $19.39 | $21.35 | 2.06% |
| 20 | Seattle, WA | 93.0 | 10 | 64.4 | 8.1 | 4.12 | $24.25 | $26.70 | 2.39% |
| 21 | Madison, WI | 92.7 | 24 | 81.1 | 15.8 | 3.84 | $13.77 | $16.56 | 1.92% |
| 22 | Cleveland, OH | 92.3 | 34 | 83.2 | 10.9 | 4.04 | $15.61 | $17.73 | 2.57% |
| 23 | Orlando, FL | 92.0 | 16 | 68.3 | 10.7 | 4.15 | $23.30 | $26.36 | 3.34% |
| 24 | San Diego, CA | 91.4 | 19 | 61.8 | 9.1 | 4.35 | $25.35 | $28.20 | 2.69% |
| 25 | Houston, TX | 90.7 | 28 | 53.8 | 3.9 | 4.17 | $16.62 | $18.70 | 2.31% |
| 26 | Dallas, TX | 90.3 | 22 | 55.7 | 3.1 | 4.04 | $17.08 | $19.28 | 2.18% |
| 27 | Hartford, CT | 90.1 | 38 | 89.7 | 17.6 | 4.02 | $18.36 | $21.33 | 2.24% |
| 28 | Baltimore, MD | 89.7 | 37 | 71.7 | 15.1 | 4.11 | $18.24 | $20.10 | 2.11% |
| 29 | New Orleans, LA | 89.3 | 23 | 54.4 | 13.9 | 4.04 | $17.00 | $19.60 | 3.12% |
| 30 | Austin, TX | 89.2 | 31 | 61.5 | 9.1 | 4.21 | $20.24 | $22.37 | 2.25% |
| 31 | Tampa, FL | 88.4 | 36 | 71.4 | 5.7 | 4.09 | $17.90 | $20.59 | 2.75% |
| 32 | Nashville, TN | 88.4 | 30 | 67.6 | 9.7 | 4.00 | $18.32 | $20.28 | 2.37% |
| 33 | Poughkeepsie, NY | 88.0 | 29 | 68.5 | 12.9 | 3.93 | $17.91 | $21.35 | 2.13% |
| 34 | Indianapolis, IN | 87.9 | 46 | 85.7 | 9.0 | 4.01 | $17.94 | $19.71 | 2.51% |
| 35 | Kansas City, MO | 87.8 | 39 | 66.7 | 5.4 | 4.10 | $17.89 | $19.81 | 2.46% |
| 36 | Miami, FL | 87.7 | 18 | 54.3 | 3.6 | 3.93 | $18.06 | $20.84 | 2.65% |
| 37 | Providence, RI | 87.2 | 50 | 87.7 | 19.0 | 4.05 | $18.40 | $21.51 | 2.49% |
| 38 | Atlanta, GA | 87.1 | 26 | 57.3 | 3.8 | 3.98 | $18.95 | $20.60 | 2.38% |
| 39 | Norfolk, VA | 86.8 | 35 | 68.4 | 8.9 | 3.83 | $16.72 | $18.47 | 2.31% |
| 40 | San Antonio, TX | 86.8 | 32 | 51.6 | 8.3 | 4.12 | $19.21 | $20.57 | 2.83% |
| 41 | Bridgeport, CT | 86.6 | 49 | 89.7 | 16.4 | 3.92 | $18.11 | $20.84 | 1.82% |
| 42 | Cincinnati, OH | 86.3 | 41 | 68.1 | 8.5 | 4.06 | $18.14 | $20.61 | 2.59% |
| 43 | Fresno, CA | 86.1 | 32 | 52.7 | 16.6 | 4.07 | $18.79 | $21.16 | 2.92% |
| 44 | Columbus, OH | 85.9 | 50 | 80.2 | 14.2 | 4.10 | $20.92 | $22.65 | 2.93% |
| 45 | Salt Lake City, UT | 85.8 | 43 | 65.9 | 9.9 | 3.95 | $17.86 | $19.22 | 2.04% |
| 46 | Sacramento, CA | 85.4 | 45 | 62.7 | 8.1 | 4.13 | $19.98 | $22.97 | 2.35% |
| 47 | Minneapolis, MN | 85.3 | 55 | 73.1 | 6.5 | 4.13 | $18.00 | $21.75 | 2.17% |
| 48 | Portland, OR | 85.2 | 50 | 60.9 | 12.4 | 4.26 | $19.83 | $22.27 | 2.31% |
| 49 | Richmond, VA | 84.9 | 40 | 68.3 | 12.4 | 3.86 | $17.29 | $20.24 | 2.31% |
| 50 | Colorado Springs, CO | 84.7 | 48 | 68.1 | 18.6 | 3.95 | $17.56 | $20.30 | 2.19% |
| 51 | Spokane, WA | 84.3 | 47 | 61.4 | 14.5 | 3.88 | $15.83 | $18.25 | 2.43% |
| 52 | Tucson, AZ | 83.2 | 42 | 59.5 | 14.1 | 3.91 | $17.89 | $20.49 | 2.86% |
| 53 | Charleston, SC | 83.1 | 64 | 75.0 | 10.5 | 4.08 | $18.25 | $19.87 | 2.33% |
| 54 | Grand Rapids, MI | 83.0 | 68 | 80.4 | 14.0 | 3.88 | $14.14 | $16.17 | 2.02% |
| 55 | Allentown, PA | 82.8 | 61 | 76.3 | 21.2 | 3.87 | $16.70 | $18.96 | 2.29% |
| 56 | Charlotte, NC | 82.6 | 63 | 63.5 | 6.3 | 4.10 | $17.32 | $19.79 | 2.37% |
| 57 | Harrisburg, PA | 82.4 | 66 | 73.8 | 28.5 | 3.82 | $14.17 | $16.74 | 2.09% |
| 58 | Little Rock, AR | 82.2 | 44 | 58.6 | 12.2 | 3.50 | $15.10 | $17.67 | 2.57% |
| 59 | Scranton, PA | 82.0 | 64 | 78.6 | 30.6 | 3.80 | $15.88 | $18.66 | 3.05% |
| 60 | San Jose, CA | 81.6 | 55 | 54.4 | 13.8 | 4.10 | $24.28 | $27.22 | 1.75% |
| 61 | Raleigh, NC | 81.5 | 58 | 64.9 | 8.5 | 3.90 | $17.28 | $19.59 | 1.99% |
| 62 | Birmingham, AL | 80.6 | 50 | 55.2 | 7.8 | 3.88 | $17.57 | $19.63 | 2.79% |
| 63 | Worcester, MA | 80.5 | 71 | 80.4 | 17.3 | 3.75 | $16.32 | $18.74 | 1.94% |
| 64 | Jacksonville, FL | 80.3 | 58 | 63.5 | 5.7 | 3.80 | $16.70 | $19.06 | 2.41% |
| 65 | Louisville, KY | 79.8 | 62 | 69.3 | 12.6 | 3.98 | $20.08 | $23.58 | 3.29% |
| 66 | Des Moines, IA | 79.8 | 71 | 86.2 | 18.3 | 3.82 | $18.45 | $20.15 | 2.43% |
| 67 | Memphis, TN | 79.7 | 50 | 58.6 | 4.9 | 3.62 | $17.12 | $18.81 | 2.92% |
| 68 | Cape Coral, FL | 79.2 | 80 | 75.2 | 15.1 | 4.00 | $17.55 | $19.54 | 2.70% |
| 69 | Akron, OH | 78.9 | 83 | 83.2 | 24.8 | 3.70 | $13.81 | $16.04 | 2.21% |
| 70 | Chattanooga, TN | 78.9 | 74 | 61.3 | 10.9 | 3.97 | $16.28 | $18.17 | 2.61% |
| 71 | Bakersfield, CA | 78.9 | 57 | 58.9 | 14.6 | 3.94 | $21.20 | $22.67 | 3.31% |
| 72 | Dayton, OH | 78.2 | 75 | 73.8 | 17.6 | 3.78 | $16.70 | $18.18 | 2.70% |
| 73 | Omaha, NE | 78.1 | 78 | 77.8 | 15.2 | 3.89 | $17.82 | $20.22 | 2.43% |
| 74 | Fayetteville, AR | 78.1 | 66 | 69.6 | 9.0 | 3.70 | $17.39 | $19.61 | 2.48% |
| 75 | Knoxville, TN | 77.7 | 58 | 66.0 | 11.1 | 3.61 | $18.18 | $20.44 | 2.87% |
| 76 | Oklahoma City, OK | 76.8 | 80 | 58.4 | 10.8 | 3.91 | $15.88 | $17.62 | 2.49% |
| 77 | Riverside, CA | 76.8 | 82 | 58.5 | 3.2 | 4.09 | $17.73 | $20.24 | 2.25% |
| 78 | Honolulu, HI | 76.7 | 71 | 65.5 | 11.6 | 3.95 | $24.10 | $27.24 | 2.59% |
| 79 | Provo, UT | 76.3 | 75 | 65.9 | 8.9 | 3.64 | $16.97 | $18.75 | 1.84% |
| 80 | Toledo, OH | 75.6 | 87 | 78.5 | 24.2 | 3.75 | $16.70 | $19.34 | 2.97% |
| 81 | Greensboro, NC | 75.6 | 70 | 61.6 | 13.2 | 3.42 | $16.46 | $19.09 | 2.92% |
| 82 | Baton Rouge, LA | 75.3 | 69 | 51.1 | 6.5 | 3.59 | $16.00 | $17.50 | 2.70% |
| 83 | North Port, FL | 75.2 | 97 | 71.4 | 14.2 | 3.97 | $16.30 | $19.20 | 2.34% |
| 84 | Boise City, ID | 74.9 | 95 | 67.1 | 12.5 | 3.92 | $16.28 | $18.59 | 2.20% |
| 85 | El Paso, TX | 74.3 | 78 | 52.9 | 12.8 | 3.55 | $13.82 | $15.40 | 2.57% |
| 86 | Winston-Salem, NC | 74.0 | 93 | 61.6 | 10.4 | 3.90 | $15.97 | $17.51 | 2.70% |
| 87 | Deltona, FL | 73.8 | 91 | 68.3 | 8.6 | 3.86 | $16.49 | $19.37 | 2.78% |
| 88 | Lakeland, FL | 73.3 | 85 | 71.4 | 7.9 | 3.73 | $17.99 | $20.03 | 2.95% |
| 89 | Ogden, UT | 73.0 | 93 | 65.9 | 8.4 | 3.62 | $15.74 | $17.42 | 1.72% |
| 90 | Albuquerque, NM | 73.0 | 85 | 49.5 | 16.1 | 3.89 | $17.43 | $19.13 | 2.81% |
| 91 | Palm Bay, FL | 72.6 | 99 | 68.3 | 9.2 | 3.79 | $15.70 | $17.99 | 2.23% |
| 92 | Tulsa, OK | 72.2 | 75 | 52.9 | 10.2 | 3.64 | $18.11 | $20.82 | 3.09% |
| 93 | Jackson, MS | 71.6 | 84 | 50.3 | 7.2 | 3.44 | $15.17 | $17.27 | 2.88% |
| 94 | Greenville, SC | 71.6 | 87 | 64.0 | 3.4 | 3.54 | $16.85 | $19.61 | 2.73% |
| 95 | Oxnard, CA | 71.6 | 100 | 61.3 | 9.9 | 4.00 | $19.71 | $21.68 | 2.00% |
| 96 | Columbia, SC | 71.4 | 89 | 59.1 | 8.9 | 3.74 | $17.08 | $19.71 | 2.85% |
| 97 | Augusta, GA | 69.9 | 90 | 54.3 | 9.4 | 3.30 | $16.98 | $18.26 | 2.73% |
| 98 | McAllen, TX | 69.4 | 91 | 39.1 | 14.4 | 3.64 | $14.97 | $17.00 | 3.10% |
| 99 | Stockton, CA | 69.0 | 98 | 62.7 | 10.4 | 3.70 | $18.13 | $20.87 | 2.32% |
| 100 | Wichita, KS | 67.9 | 95 | 63.0 | 16.8 | 3.40 | $19.38 | $22.17 | 3.20% |
*Clever’s Pizza Passion Score is compiled using Google search data for pizza and pizza-related topics in a metro area. The score is out of 100.
**Percentage of the metro area’s median household income required to buy one large cheese and one large pepperoni pizza per week.
The 20 Best Cities for Pizza in the U.S.
1. Rochester, New York
Score: 100/100
| 💗 Passionate and Plentiful: Rochester earned its top spot in part through a strong interest in pizza, demonstrated by its Pizza Passion Score of 98 out of 100 and more than twice as many pizza restaurants per capita than average (25 vs. 12.4, respectively). |
Rochester residents have good reason to be passionate about their local pies, too. Pizza restaurants in the city earn a typical Yelp score of 4.11 out of 5, above the national average of 3.93. Roughly 9% of Americans believe Rochester is a top-five pizza city, good for 12th place overall, an impressive showing for a relatively lesser-known metro.
It’s an ideal place to try the distinctively delicious Western New York style of pizza. As opposed to its better-known New York City cousin, Western New York pizza differentiates itself with a thicker, chewy crust, a subtly sweeter sauce, and “cup-and-char” pepperoni, which curls into small cups as it crisps during baking.
2. Philadelphia, Pennsylvania
Score: 98.9/100
| 🧀 Cheesesteaks and Cheese Pies: Philadelphia has earned a strong reputation for pizza among Americans, winning 4th place overall, with 17% of Americans picking it as a top-five pizza city. |
Residents of the City of Brotherly Love share a lot of that love with their local pizza joints, which earn an average Yelp rating of 4.19 out of 5, notably higher than the national average of 3.93.
Philly also earns an above-average Pizza Passion Score of 76.3 out of 100, eight points higher than the country as a whole (68.3).
Although it might not have the prominence of New York-, Chicago-, or Detroit-style pizza, Philadelphia boasts a respectable pizza heritage, particularly the city’s beloved tomato pies. Often served at room temperature, the thick, focaccia-like crust is topped with nothing other than quality tomato sauce and a shake or two of parmesan cheese.
» Read More Stats on Pennsylvania
3. Boston, Massachusetts
Score: 97.7/100
| 🤑 Cheap Pizza, High Salaries: A love of pizza won’t break the bank in Boston, where the share of the local median household income required to buy one cheese and one pepperoni pizza per week (1.77%) is the fourth-lowest in the country. |
This affordable pizza doesn’t compromise on quality either, with Boston’s pizzerias earning an above-average Yelp rating of 4.09 out of 5 stars. Altogether, it helps this historic Northeastern city earn an 80.4 out of 100 Pizza Passion Score, almost 18% higher than average.
Boston’s contribution to the world of pizza comes in the form of Greek-style pizza, which, despite its name, doesn’t usually include typical Greek flavors such as feta or gyro meat. Instead, it’s characterized by an olive oil-enriched crust and a rich tomato sauce and is proofed and cooked in a shallow pan.
Despite this style not being common outside New England, 14% of Americans selected Boston as a top-five pizza city, coming in at 7th overall.
» Read More Stats on Massachusetts
4 (tie). Detroit, Michigan
Score: 97.4/100
| 🏎 Pan Pizza Popularity: Detroit’s not just the Motor City; it’s apparently also the Pizza City. It ranks No. 5 among survey respondents’ top-ranked pizza cities, with 16% saying it’s among the country’s top five. |
Detroit also earns a strong Pizza Passion score of 80.6 out of 100. That can be explained in part by Detroit pizza’s rise into the national spotlight in recent years. The thick, chewy, rectangular pies are cooked in high-sided pans like the type once designed as a parts tray for the auto industry. Sauce is applied in dollops or stripes, and cheese spread to the edge of the crust helps create a crispy, lacy texture.
Despite its popularity and filling nature, pizza in Detroit is also more affordable than average for typical large cheese pies ($16.25 vs. $18.02) and large pepperoni pies ($17.86 vs. $20.42).
Detroit’s high score is particularly impressive, considering it only has 6.8 pizza restaurants per 100,000 residents, barely half the national average (12.4).
4 (tie). Buffalo, New York
Score: 97.4/100
| 💝 Pure Passion: No city is more serious about its pizza than Buffalo, which earned a perfect 100 Pizza Passion Score. |
Buffalo seems to love its pizza nearly as much as its namesake wings, and the evidence is more than just online. There are 30 pizza restaurants in Buffalo per 100,000 residents, roughly 2.5x the national average of 12.4.
The city is known for the same Western New York style that’s so beloved in nearby No. 1 Rochester, alongside the more traditional New York City style.
Americans agree that Buffalo has supreme pizza, as it ranks No. 6 in the survey of top pizza cities, with about 16% saying it belongs in the top five nationally.
6. New Haven, Connecticut
Score: 96.7/100
| 🔥 One-of-a-Kind Pizza – and Plenty of It: One of the smaller cities to boast its own unique pizza style, New Haven is no doubt a top pizza destination thanks to the 35.6 pizza restaurants per 100,000 residents, the most in America. |
One of the few pizza styles that can directly trace its roots to a single pizzeria, New Haven-style was born at the famous Frank Pepe Pizzeria Napoletana a century ago and has become known around the pizza world for the coal-fired charring and relatively scant amount of cheese.
This pizza heritage has made an impact. About 1 in 11 (9%) picked it as a top five American pizza city, better than all but nine other cities. It’s one of the many ways New Haven’s reputation looms much larger than the town of roughly 135,000 residents itself.
Of course, it helps that New Haven residents are truly dedicated to their pizza. They helped their city earn an 89.7 out of 100 Pizza Passion Score, a level bested by only two other metros, Buffalo (100) and Rochester (98).
» Read More Stats on Connecticut
7. Pittsburgh, Pennsylvania
Score: 96.6/100
| 🖥 Searching for a Slice: Pittsburgh’s love of pizza shines through in its search-based Pizza Passion Score, which, at 87.6 out of 100, is the eighth-highest in America. |
Pittsburgh is known for its reasonable cost of living, a trait that extends to its pizza prices. Residents pay below-average prices for typical large cheese ($15.94) and pepperoni ($17.86) pizzas compared to $18.02 and $20.42 in the average city, respectively.
The Steel City is also home to 1.4x more pizza restaurants per 100,000 residents (17.4) than the national average (12.4).
Pittsburgh isn’t closely linked to one type of pizza, though it offers the opportunity to sample one specific regional style that’s as beloved to some locals as it is bizarre to outsiders: cold cheese pizza. Popularized by the restaurant Beto’s, cold shredded cheese is sprinkled on top of the pizza after it comes out of the oven and only partially melts from the residual heat before serving. It’s similar to the Ohio Valley style that hails from just over the border in Steubenville, Ohio.
8. New York, New York
Score: 95.5/100
| 🌆 Pizza City USA: There’s no American city more synonymous with pizza than New York, with more Americans selecting it as a top pizza city than any other — 66%. |
According to Yelp, the Big Apple’s pizzerias live up to their reputation, earning an average rating of 4.19 out of 5, substantially higher than the average of 3.93 across the country.
America’s pizza scene was born in the Big Apple, with Lombardi’s widely accepted as the country’s first pizzeria. From these early Neapolitan-inspired pies, New York-style pizza was born: large, hand-tossed pies with a distinctive combination of a substantial crust and a thin, foldable interior.
The style’s characteristic size is one reason why average prices are the highest in the country ($26 for a large cheese and $29.75 for a large pepperoni on average), along with the general cost of living in the city.
This price issue, along with a merely average number of pizzerias per capita (12.3), is what kept this iconic pizza city from a higher ranking.
9. Albany, New York
Score: 94.8/100
| 🏛 Statewide Pizza Passion: The fourth New York metro in the top 10, Albany has a strong Pizza Passion Score of 89.6 out of 100 and roughly 1.7x more pizza restaurants per 100,000 residents (20.9) than average (12.4). |
New York’s capital also provides cheaper-than-average pizza, with large cheese pies costing $16.37 and large pepperoni ones selling for $18.54.
Although it may not be particularly well known, Albany still earned a respectable 15th place among the top pizza cities from survey respondents, with around 7% picking it in their top five.
Albany pizza lovers will find primarily New York City-style pies, though the metro’s pizza scene is also influenced by nearby Utica and its “upside-down”-style pizza popularized by O’Scugnizzo Pizza, with sauce applied on top of the cheese.
10. Chicago, Illinois
Score: 94.7/100
| 🌬 Blown Away by Chicago Pizza: America’s Second City is also second in pizza, ranking No. 2 among Americans’ top pizza cities. Just over 57% of survey respondents list it as a top-five city for pizza. |
As the home of America’s second-favorite pizza style (per the Clever survey), this reputation makes sense, particularly considering Chicago’s significant contribution to America’s pizza scene: deep dish. Crafted in a high-edged pan with extensive amounts of cheese and toppings placed under a thick layer of chunky tomato sauce, it’s a far cry from typical pizza and can be somewhat polarizing for this reason.
Chicagoans’ love for their unique pizza is as deep as the dish it’s baked in, earning the Windy City a significantly above-average Pizza Passion Score of 83.1 out of 100, compared to 68.3 nationally.
However, like New York, this beloved pizza city was held back in the rankings by high prices: $22.73 for a typical large cheese pizza and $26.10 for a large pepperoni, compared to the national averages of $18.02 and $20.42, respectively.
Although the ingredient-heavy nature of Chicago-style pizza can explain some of these extra costs, it still adds up to an above-average 2.92% of the city’s median household income to buy weekly cheese and pepperoni pizzas.
11. Syracuse, New York
Score: 94.6/100
| 🍕🍕 Twice as Nice: Finding pizza in Syracuse is simple, thanks to the 26.8 pizzerias per 100,000 residents, nearly 2.2x the national average. |
It’s likely this may help keep prices down, as Syracuse diners spend an average of $16.60 for a large cheese pie (vs. $18.02 nationally) and $19.00 for a large pepperoni (vs. $20.42 nationally).
Perhaps from its association with New York State or other popular pizza cities in the region, Syracuse came in 13th when Americans were surveyed about their top picks, with just over 7% selecting it as a top-five choice.
Syracuse also earned an 82.7 out of 100 Pizza Passion Score, well above average (68.3).
12. Los Angeles, California
Score: 94.2/100
| 🎥 Lights, Camera, Pizza: Though it might not have the pizza history or prestige of New York or Chicago, nearly 1 in 4 Americans (22%) ranked Los Angeles as a top pizza city, the third highest. |
From high-end spots to neighborhood restaurants, L.A. pizzerias earn an average of 4.3 out of 5 Yelp stars. That’s nearly 10% above the national average of 3.93, good for third-best in the nation.
Unfortunately, it may be relatively hard to find pizza in Los Angeles, with just five pizza restaurants per 100,000 residents compared to 12.4 in the typical city.
Los Angeles is a great spot to try the Golden State’s contribution to the pizza world, known as California style. On top of a traditionally thin, tossed crust, adventurous chefs forged a new variety by adding sophisticated or unusual toppings such as sun-dried tomatoes, broccoli, goat cheese, prosciutto, and more.
» Read More Stats on California
13. Las Vegas, Nevada
Score: 94.1/100
| 🎰 Hitting the Pizza Jackpot: You don’t have to be lucky to find delicious pizza in Sin City, with an above-average 19.3 pizza restaurants per 100,000 residents and a higher-than-average typical Yelp rating of 4.19 out of 5 stars. |
Though not typically an area known for pizza, Las Vegas, somewhat surprisingly, ranked ninth when Americans were asked to name the best U.S. pizza cities, with over 10% putting it in the top five. In addition to being home to plenty of pizza-loving transplants from the Northeast and Chicago areas, Vegas’ status as an entertainment destination has also lured higher-end chefs and restaurants for those looking for an upscale pie.
Unfortunately, local salaries don’t seem to have kept up with pizza costs. Buying one large pepperoni pizza and one large cheese pizza per week costs 3.56% of the area’s median household income, more than any other city studied.
14. San Francisco, California
Score: 94/100
| 💰 No Pizza Penny-Pinching: A weekly pizza night in San Francisco with one pepperoni and one cheese pie is the fifth most affordable in the country as a percentage of median household income, just 1.80% compared to the national average of 2.51%. |
This is solely due to the area’s sky-high median income, as typical cheese ($20.79) and pepperoni ($23.44) pizzas cost more than the national average ($18.02 and $20.42, respectively).
As the home region of California-style pizza, hungry diners are sure to find plenty of that type on local menus. However, San Francisco’s vibrant food scene and numerous transplants from other regions have helped it develop a diverse and noteworthy pizza culture, too. San Francisco ranks No. 8 in the survey of Americans’ top pizza cities, thanks to nearly 14% selecting it as a top-five choice.
San Francisco pizza restaurants are well-reviewed by diners, too, with a 4.31 out of 5-star average rating on Yelp, the second-highest in the country.
15. Milwaukee, Wisconsin
Score: 93.5/100
| 🍺 Brewing up Passion for Pizza: Pizza and beer is a classic combination, so it makes sense that Milwaukee has an above-average Pizza Passion Score (76.3 out of 100 vs. 68.3 nationally). |
Milwaukee pizza restaurants earn an average of 4.08 out of 5 stars on Yelp, above the national average of 3.93. In addition, over 7% of Americans selected Milwaukee as a top-five pizza, placing the city at No. 14.
Stylewise, Milwaukee is known for pizza that’s about as far from nearby Chicago’s deep dish as possible. The thin, sometimes cracker-like crust is topped with Wisconsin cheese and often enhanced with sausage, mushroom, and peppers.
» Read More Stats on Wisconsin
16. Phoenix, Arizona
Score: 93.3/100
| 🌵 Desert Delight: Scores for local pizza spots soar as high as the temperatures in Phoenix, earning an average of 4.25 out of 5 stars on Yelp. Nationally, the average is 3.93. |
Phoenix residents also won’t have to bust their budget to enjoy a delicious pie. Large cheese pizzas average $16.83 each, compared to $18.02 nationally, and large pepperoni pizzas average $19.46, lower than $20.42 nationally
Relatively strong local salaries also mean buying one pepperoni pizza and one cheese pizza per week costs just 2.2% of the area’s median income.
Another city rich in transplants, Phoenix’s pizza scene includes a diverse mix of styles, from New York-, Chicago-, and California-influenced pies to pizzas with Southwestern flair typical of the region’s cuisine.
17 (tie). Washington, D.C.
Score: 93.1/100
| 🍅 Saucy Savings: Nowhere in the country allows pizza lovers to order a pepperoni and a cheese pie each week for a lower portion of their median income – just 1.63%. |
Washington’s pizza restaurants are also well-reviewed, earning 4.14 out of 5 Yelp stars, higher than the national average of 3.93. In addition, pizza prices are narrowly lower than national averages: $17.80 for a typical large cheese compared to $18.02 nationally and $20.31 for a pepperoni pie vs. $20.42 nationally.
Stylistically, D.C. offers something for all kinds of pizza lovers. Those looking for sophisticated, high-end pies will find a variety of premium pizzerias throughout the District, while late-night revelers and truly hungry diners can grab a jumbo slice, a gargantuan (if sometimes only middling-quality) piece of pizza that can stretch more than a foot in length.
17 (tie). St. Louis, Missouri
Score: 93.1/100
| 👌 Crazy for Cracker Crust: Like many cities that have developed their own unique pizza styles, St. Louis takes its pies seriously, earning a Pizza Passion Score of 79.4 out of 100, over 10 points higher than the average of 68.3 |
St. Louis pizza is characterized by its ultra-thin, crispy, cracker-like crust topped with a blend of cheddar, provolone, and Swiss known as Provel cheese. It was popularized by the legendary local chain Imo’s Pizza but has since spread to numerous competitors.
There’s little doubt St. Louis residents are pleased with their local options. Area pizza restaurants score 4.2 out of 5 stars on Yelp, significantly higher than the 3.93 national average.
Despite this quality, prices are right in line with national average pizza prices, at $18.03 for large cheese, just a penny more than the country as a whole.
19 (tie). Denver, Colorado
Score: 93/100
| 🏔 Not-So-Rocky-Mountain-High Prices: 2024’s top U.S. pizza city fell sharply this year, though it still earned a spot in America’s top 20 pizza cities with a weekly order of cheese and pepperoni pizzas costing 2.06% of median local income. Nationally, the average is 2.51%. |
Denver pizza joints earn an average Yelp rating as lofty as the elevation, 4.22 out of 5, compared to 3.93 across all U.S. pizza restaurants surveyed.
Denver is also right in line with the typical American city’s Pizza Passion Score, earning a 67.1 out of 100, just slightly lower than the 68.3 national average.
The Mile High City is one of the best places for pizza aficionados to try the regional version known as Colorado-style pizza. Originating at the popular chain Beau Jo’s, the so-called “mountain pies” stand out for their thick, slightly sweet crust made from whole-wheat flour. Not only is the dough infused with honey, it’s often served with extra for drizzling on the crust, creating a savory-sweet combo beloved by millions in the Mountain West.
19 (tie). Seattle, Washington
Score: 93/100
| ☕ Foodie Favorite: Seattle’s not just a coffee city; it’s a pizza one, too. It ranked 10th overall when Americans were asked to name the best pizza cities, with around 1 in 11 (9%) putting it in the top five. |
Local pizza joints in Seattle score an average of 4.12 out of 5 Yelp stars, above the national average (3.93). Similarly, the median income required to buy two weekly large pizzas (one cheese and one pepperoni) is slightly under the typical percentage, 2.39% vs 2.51%.
Seattle earned a spot in the top 20 despite not having a particularly defined pizza style unique to the city. However, top local pizza joints often serve pies with a heavy focus on local, farm-to-table ingredients, a nod to the city’s overall status as a haven for foodies.
» Read More Stats on Washington
Honorable Mentions
21. Madison, Wisconsin (92.7/100): Madison benefits from pizza affordability, with the lowest average price for a cheese pizza in the country, $13.77. It also has a strong Pizza Passion Score of 81.1 out of 100.
22. Cleveland, Ohio (92.3/100): Cleveland has one of the highest rates of pizzerias per capita, with 34 per 100,000 residents, in addition to a high Pizza Passion Score (83.2 out of 100).
23. Orlando, Florida (92/100): Orlando’s pizza restaurants are apparently well-liked by people who have eaten there, earning an above-average 4.15 out of 5 stars on Yelp.
24. San Diego, California (91.4/100): This Southern California city earned the highest average Yelp score of any of the 100 metros studied, 4.35 out of 5 stars.
25. Houston, Texas (90.7/100): Despite a relatively low number of pizza restaurants per 100,000 residents (3.9), typical Houston pizzas are cheaper than average: $16.62 for large cheese and $18.70 for large pepperoni, versus $18.02 and $20.42 nationally, respectively.
New York Is America’s Best Pizza State
| Ranking | State | % Selected in Top Five |
| 1 | New York | 77% |
| 2 | Illinois | 56% |
| 3 | California | 45% |
| 4 | New Jersey | 33% |
| 5 | Pennsylvania | 23% |
| 6 | Florida | 21% |
| 7 | Texas | 19% |
| 8 | Michigan | 18% |
| 9 | Massachusetts | 17% |
| 10 | Connecticut | 15% |
| 11 | Wisconsin | 12% |
| 12 | Washington | 11% |
| 13 | Ohio | 10% |
| 14 | Arizona | 9% |
| 15 (tie) | Colorado | 8% |
| 15 (tie) | Nevada | 8% |
| 15 (tie) | Hawaii | 8% |
| 18 (tie) | Tennessee | 7% |
| 18 (tie) | Georgia | 7% |
| 20 (tie) | Virginia | 6% |
| 20 (tie) | North Carolina | 6% |
| 20 (tie) | Maryland | 6% |
| 23 (tie) | Indiana | 5% |
| 23 (tie) | Louisiana | 5% |
| 23 (tie) | Missouri | 5% |
| 23 (tie) | Rhode Island | 5% |
| 27 (tie) | Alabama | 4% |
| 27 (tie) | West Virginia | 4% |
| 29 (tie) | Oregon | 3% |
| 29 (tie) | South Carolina | 3% |
| 29 (tie) | Delaware | 3% |
| 29 (tie) | Vermont | 3% |
| 29 (tie) | Kansas | 3% |
| 29 (tie) | Kentucky | 3% |
| 29 (tie) | Minnesota | 3% |
| 29 (tie) | Arkansas | 3% |
| 29 (tie) | Utah | 3% |
| 38 (tie) | New Hampshire | 2% |
| 38 (tie) | Oklahoma | 2% |
| 38 (tie) | Iowa | 2% |
| 38 (tie) | Alaska | 2% |
| 38 (tie) | Maine | 2% |
| 38 (tie) | Wyoming | 2% |
| 38 (tie) | Mississippi | 2% |
| 38 (tie) | New Mexico | 2% |
| 38 (tie) | Nebraska | 2% |
| 47 (tie) | Idaho | 1% |
| 47 (tie) | Montana | 1% |
| 47 (tie) | South Dakota | 1% |
| 47 (tie) | North Dakota | 1% |
More than three-quarters of Americans (77%) listed the Empire State as one of America’s five best pizza states, more than any other. Five New York cities rank in our top 20: Rochester (No. 1), Buffalo (No. 5), New York (No. 8), Albany (No. 9), and Syracuse (No. 11). Poughkeepsie also came in at No. 33, rounding out the top third.
Second-place Illinois, home to No. 10 Chicago’s iconic deep dish, is more than 20 percentage points behind in American pizza views, listed by 56% of Americans as a top-five pizza state.
California (45%) and New Jersey (33%) also stand out, as well as Pennsylvania (23%). In fifth place, the Keystone State is the only one other than New York to have multiple top 10 cities: No. 2 Philadelphia and No. 7 Pittsburgh.
Things are considerably more grim for pizza lovers in the northern plains, with just 1% each saying North Dakota, South Dakota, Montana, and Idaho are top pizza states.
Out of the top 20 pizza cities in the U.S., nine are in the Northeast, evidence that the region still “has the sauce,” with the country’s longest and most diverse pizza heritage. Six are located in the West, beating out the four found in the Midwest, which includes iconic pizza cities No. 4 Detroit and No. 10 Chicago.
Only one Southern city, No. 17 Washington, D.C., ranks in the top 20 American pizza cities.
1 in 3 Americans Love Pizza Enough to Move to Better Pizza Cities
Although there might be more important things to consider when evaluating a city, there may not be any more important food to check out than pizza. A majority of Americans (59%) say pizza is their favorite food, with Gen Z (73%), millennials (65%), Gen X (63%), and those from the Northeast (62%) most likely to say so.
The latter group makes sense, considering the significant number of Northeastern cities near the top of our rankings. Two-thirds of people from the Northeast (67%) also believe their area has above-average pizza, far higher than any other region and 25 percentage points higher than the South (42%).
The vast majority (87%) of Americans say they prefer to get their pizza from small, independent pizza places over large chains. However, this ranges from 90% of boomers down to just 77% of Gen Z.
America’s passion for pizza goes a lot further than just frequent orders from their neighborhood spot. More than a third (35%) would even consider moving to a city with better pizza, including around half of younger generations, such as millennials (52%) and Gen Z (48%).
To be sure, the idea of uprooting your life for pizza may sound a bit cheesy. But in reality, many see more benefits to premium pizza proximity than just a delicious slice now and then.
A majority of Americans (58%) believe being close to popular restaurants, including pizzerias, increases property values, including two-thirds of millennials (67%) and 62% of those in the South. That’s backed up by the fact that 42% say that if a neighborhood had multiple top-rated pizza places, it would make them more likely to move there.
About 1 in 4 (25%) would even pay more for a home close to popular pizza places, with 47% of Gen Z saying so. It’s particularly important for homeowners and potential buyers to take these preferences into consideration, as these younger generations will be the majority of buyers in the years ahead.
From New York-Style to Clam-Topped: America’s Favorite and Least Favorite Pizza Styles
Our tour of the best pizza cities in the U.S. exposed a dizzying array of styles and presentations for this deceptively complex food. However, despite the many options, the country’s most beloved style is a familiar one.
New York-style pizza, known for its thin, foldable crust and large slices, is America’s favorite, loved by 51% of respondents and liked by 38% more. Just 5% feel negatively about it.
Thick, saucy Chicago-style pizza came in second (40% love, 40% like), followed by two more authentic varieties: bready Sicilian (36% love, 41% like) and traditional Neapolitan (36% love, 39% like).
Three-quarters of Americans or more view all four styles positively. Four others earn positive reviews from a majority of Americans: fresh, foldable California-style (63%), thick, rectangular Detroit-style (63%), St. Louis-style’s thin cracker crust (55%), and even the controversial Hawaiian pizza (56%), often criticized for the unusual pairing of ham and pineapple toppings.
America’s least favorite style is clam pizza, a unique variety hailing from Connecticut made without red sauce and with plenty of its namesake seafood. Although 51% admit never having tried it, only about 1 in 6 (16%) have any positive feelings toward it, half as many as feel negatively (33%).
Clam pizza isn’t the only notable style that’s seemingly unknown to many Americans. Over half (54%) had never heard of Ohio Valley-style pizza, which hails from the small town of Steubenville. Sometimes compared to a Lunchable, it’s marked by cold toppings sprinkled just before serving on top of a square crust baked with sauce.
A similar number (48%) have never heard of thick-crusted, honey-forward Colorado pizza, while 38% aren’t familiar with coal-fired New Haven-style pizza.
As much as we love pizza as a nation, not every pizza opinion is a positive one. About 1 in 3 think either New York-style (32%) or Chicago-style pizza (33%) is overrated. Those in the Midwest are most likely to say that about New York pizza (42%), while Northeasterners are most likely to say the same about Chicago pizza (36%).
Rankings by Category
Methodology
Data for this study was obtained from the US Census, American Community Survey, Yelp, and more than 1,000 pizza restaurant websites.
In addition, we conducted a survey of 2,000 American adults, asking them about their pizza preferences.
To obtain our ranking, data points were weighted as follows:
- Pizza Reputation (survey of 2,000 Americans): 43%
- Pizza Passion (analysis of Google search trends): 27%
- Pizza Availability (analysis of pizza restaurants): 20% (8% pizza restaurant counts and 12% Yelp ratings)
- Pizza Affordability (cost analysis): 10% (4% cheese pizza prices, 4% pepperoni pizza prices, and 2% affordability on a median household income)
Scores were indexed on a scale of 0 to 100, where 100 indicates the best pizza city overall across these metrics, and 0 indicates a theoretical worst pizza city.
About Clever
Since 2017, Clever Real Estate has been on a mission to make selling or buying a home easier and more affordable for everyone. Twelve million annual readers rely on Clever’s library of educational content and data-driven research to make smarter real estate decisions — and to date, Clever has helped consumers save more than $180 million on realtor fees. Clever’s research has been featured in The New York Times, Business Insider, Inman, Housing Wire, and many more.
More Research From Clever


Articles You May Like


FAQs
Which city has the best pizza in the USA?
Rochester, New York, earned the top spot through a strong Pizza Passion Score of 98 out of 100 and more than twice as many pizza restaurants per capita than average (25 vs. 12.4 overall). Learn More.
What US state has the best pizza?
More than three-quarters of Americans (77%) listed New York as one of America’s five best pizza states, more than any other. Learn more.
What’s the most popular type of pizza in America?
New York-style pizza, known for its thin, foldable crust and large slices, is America’s favorite, loved by 51% of respondents and liked by 38% more. Learn more.
What US city has the cheapest pizza?
Madison, Wisconsin, is home to America’s cheapest average large pizza ($13.77), while El Paso, Texas, serves up the most affordable average large pepperoni ($15.40). Learn more.
The post 2025 Data: Best Pizza Cities in the U.S., Ranked appeared first on Clever Real Estate.


