The story of multifamily housing in America isn’t just a story about units built. It’s a story about who rents, why they rent, and what “apartment living” actually means — and how all three have fundamentally changed.
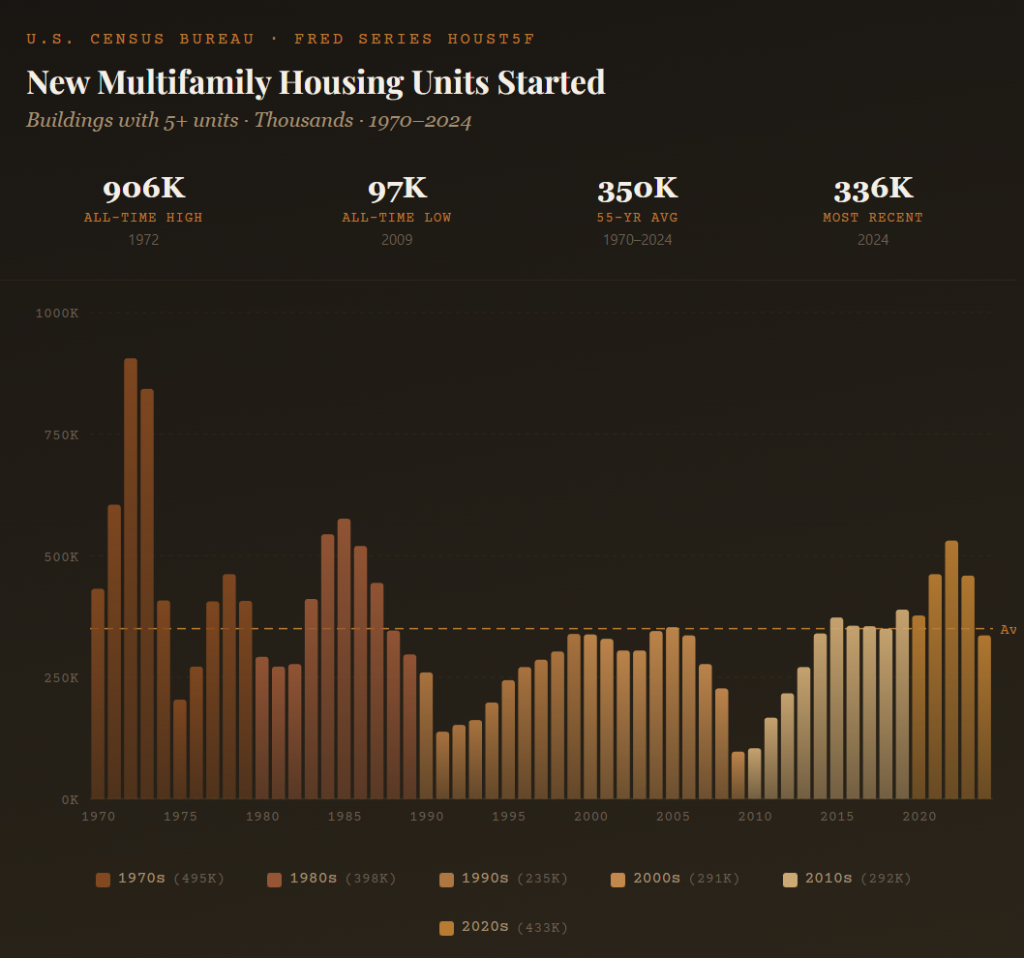
Between 1970 and 2024, developers started construction on roughly 19 million apartment units in buildings with 5 or more units across the United States. But if you walked through a typical community built in 1975 and one built in 2022, you’d think you were looking at two entirely different asset classes — because you are.
Here’s what actually happened, decade by decade.
*This post was drafted in part with AI using my prompts and thesis. What AI can do today genuinely blows my mind, and I am focused on active experimentation. Drafting this post is one such experiment.
The 1970s: Volume Over Everything (Average: 495K units/year)
The 1970s were the single most prolific decade for multifamily construction in American history. In 1972 alone, developers started 906,000 apartment units — a record that still stands today, more than 50 years later.
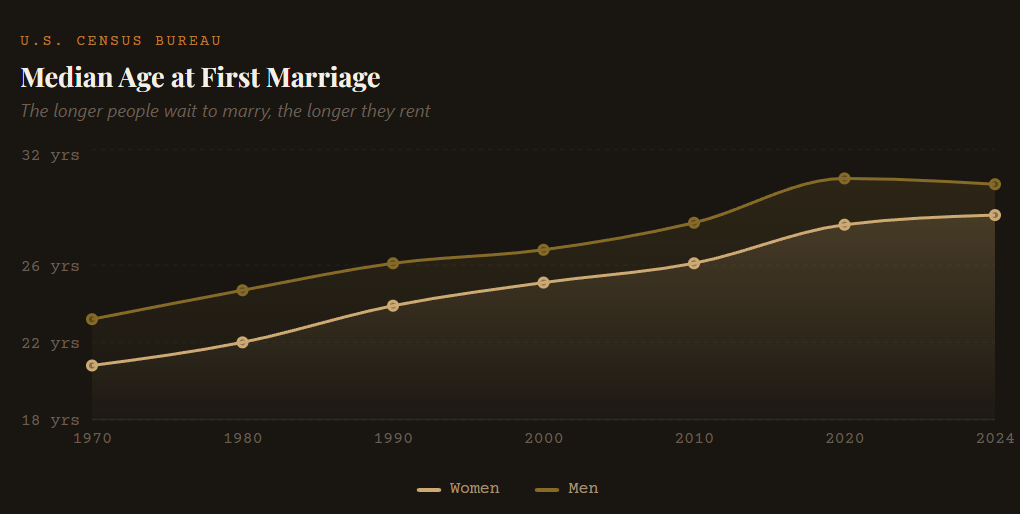
The driver was simple demographics. The Baby Boom generation — 76 million strong — was leaving home. The median age at first marriage was just 21 for women and 23 for men. Millions of young adults needed somewhere to live between leaving their parents’ house and buying their first home. The apartment was a waystation, not a destination.
And the product reflected that mindset.
The dominant format was the garden-style apartment complex: two- and three-story wood-framed walkups, spread across suburban land that was cheap and abundant. These were cookie-cutter developments — simple rectangular buildings with surface parking, basic clubhouses, maybe a pool. Flat roofs, exterior corridors, aluminum windows, carpet over concrete slab. Units were functional but spartan: laminate counters, basic appliances, hollow-core doors, minimal soundproofing (single-layer half-inch drywall was standard).
These communities weren’t built in desirable neighborhoods. They were built where land was cheapest — along highway corridors, near commercial strips, in unincorporated areas outside city limits. The operating assumption was clear: nobody aspires to live here permanently. Renting was what you did before you could afford to buy. The apartment industry’s job was to provide affordable, temporary shelter — and in the 1970s, it did that at unprecedented scale.
The construction boom was also supercharged by favorable tax policy. Accelerated depreciation schedules made apartment development an attractive tax shelter, drawing capital from investors who cared more about write-offs than operations. The result: a lot of units got built, but not with any particular attention to quality, design, or long-term durability. Many of these 1970s-vintage communities are the Class C value-add targets that investors were buying at 3 caps at the top of the market.
The 1980s: Tax-Fueled Boom and Bust (Average: 379K units/year)
The early-to-mid 1980s saw a second wave of apartment construction, peaking at 576,000 starts in 1985. But the motivation was different from the 70s. While some demographic demand remained, much of the 80s construction was driven by tax shelter incentives that made multifamily development irresistible to passive investors.
The product was marginally better than the 70s — you started seeing more attention to curb appeal, better landscaping, slightly upgraded finishes. But the fundamental template was the same: garden-style, suburban, 2-3 stories, surface-parked, built to a price point. Average apartment sizes actually grew somewhat as developers competed for tenants, but the target renter was still the same: a young person or couple marking time before homeownership.
Then came the Tax Reform Act of 1986, which eliminated the passive loss deductions that had fueled apartment investment. Overnight, the economic rationale for building changed. Combined with the S&L crisis that wiped out the thrift institutions that had financed much of this construction, multifamily starts collapsed — falling from 576K in 1985 to just 138K by 1991, a 76% decline.
The late 80s also marked the beginning of a profound stigma shift. Renting was still widely viewed as inferior to owning. “Apartment complex” conjured images of transient populations, thin walls, and generic locations. The industry had built a massive stock of essentially commoditized housing, and it would take years — and an entirely new generation of renters — to change that perception.
The 1990s: The Slow Rebuild and the Seeds of Change (Average: 235K units/year)
The 1990s were the quietest decade for apartment construction since the data series began. After the S&L collapse and tax reform, development capital was scarce and apartment demand was muted. Starts averaged just 235K per year — less than half the 70s pace.
But beneath the surface, something important was happening. The stigma around renting was starting to crack.
Several forces converged. Urbanization accelerated as young professionals were drawn to revitalizing downtown cores in cities like Chicago, Denver, and Charlotte. The first wave of “urban renaissance” projects began appearing — loft conversions in old industrial buildings, mixed-use developments with ground-floor retail, mid-rise projects in walkable neighborhoods that bore no resemblance to the garden-style complexes of the prior decades.
These weren’t being built on leftover land along highway frontage roads. They were being built in real neighborhoods — places with restaurants, cultural amenities, and proximity to employment centers. And they weren’t basic product. Developers began introducing granite countertops, stainless appliances, fitness centers, and concierge services that would have been laughable in a 1970s apartment community.
The tenant profile was evolving too. Median age at first marriage climbed from 23.3/25.5 (women/men) in 1985 to 25.1/26.8 by 2000. More young professionals were spending their 20s — and increasingly their early 30s — as renters, and they had rising incomes and higher expectations for their living environment. The apartment wasn’t just a waystation anymore. For a growing share of the population, it was becoming a lifestyle choice.
The 2000s: Bifurcation Begins (Average: 291K units/year)
The 2000s saw moderate apartment construction — starts averaged around 291K annually — but the type of product being built changed dramatically.
The decade was defined by bifurcation. On one end, the existing stock of 70s and 80s vintage garden apartments continued to age and filter down the quality spectrum. On the other end, new construction increasingly skewed luxury. Developers responded to the “renter by choice” demographic with resort-style amenity packages, architectural design that rivaled for-sale condominiums, and locations in A-grade submarkets that previous generations of apartment developers never would have considered.
The wrap-around (or “Texas Donut”) construction type became prevalent — wood-framed units wrapped around a structured parking garage, typically 4-5 stories, in urban infill and suburban town center locations. Podium construction — residential units built atop a concrete parking structure — emerged in higher-cost markets. Both formats represented a quantum leap in construction quality, cost, and renter experience from the garden-style template.
Meanwhile, the homeownership boom of 2003-2006 temporarily suppressed renter demand, as loose credit standards allowed millions of households to buy homes. But the collapse of that bubble in 2008-2009 would permanently reshape the relationship between Americans and homeownership. Starts cratered to just 97K in 2009 — the lowest level since FRED began tracking the data.
The 2010s: The Renter-by-Choice Revolution (Average: 292K units/year)
The 2010s are where my thesis really comes into focus. Coming out of the Great Recession, multifamily construction surged — but the product being delivered was overwhelmingly Class A.
Consider the numbers: approximately 80% of new apartments built during the 2010s were classified as Class A or B by CoStar. RentCafe’s analysis of buildings with 50+ units found that the decade delivered 2.4 million new apartments — a construction boom unseen since the 1980s — and an outsized share were high-end.
Why? Three reinforcing trends:
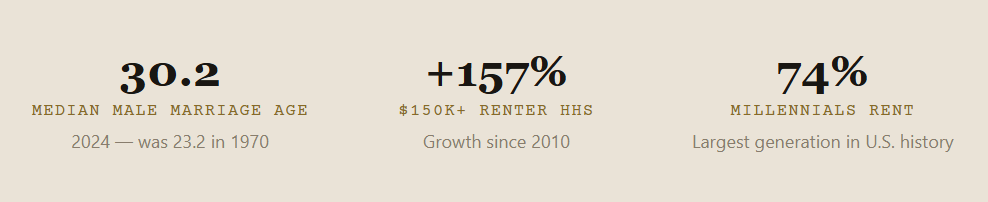
1. Demographics shifted permanently. Millennials — 72 million strong and the largest generation in American history until Gen Z — entered their prime renting years. But unlike the Boomers of the 1970s, they weren’t rushing to get married and buy houses. Median age at first marriage climbed to 27.8/29.8 (women/men) by 2018. Student debt loads ($1.7 trillion nationally) made saving for down payments difficult. Many simply chose to rent longer — and expected their rental housing to reflect their income and lifestyle aspirations.
2. Renter incomes rose dramatically. Nationally, the number of households earning more than $150K/year who rent increased 157% between 2010 and 2018, growing two times faster than high-earning homeowner households. This wasn’t a population that wanted laminate counters and aluminum windows. They wanted quartz, stainless steel, smart home technology, rooftop decks, co-working spaces, and pet spas.
3. The homeownership stigma fully inverted. For the first time in American history, renting wasn’t just accepted — it was aspirational for a significant segment of the population. The Great Recession had shattered the notion that homeownership was a guaranteed path to wealth. Meanwhile, the rise of the experience economy, remote work, and urban living made the flexibility and amenity-rich lifestyle of luxury apartments genuinely appealing. 74% of Millennials rent rather than own — and many do so by choice, not necessity.
The locations reflected this shift. New construction migrated from the suburban periphery to prime infill locations — urban cores, transit-oriented sites, and high-end suburban submarkets near top-rated schools, retail corridors, and employment centers. These weren’t the “average or below-average locations” that characterized 70s and 80s construction. These were A-locations commanding A-rents.
The 2020s: Peak Supply Meets Peak Expectations (Average: 433K units/year, 2020-2022)
The post-COVID period produced the most dramatic multifamily construction surge in 35 years. Starts hit 531K in 2022 — the highest since 1987 — driven by pandemic-era rent growth, migration to Sunbelt markets, and historically low interest rates in 2020-2021.
The product being built today represents the ultimate expression of the “renter by choice” thesis. Modern Class A communities feature:
- Construction quality that rivals or exceeds single-family homes: double-layer 5/8″ drywall, offset studs for sound isolation, luxury vinyl plank, quartz surfaces, smart-home integration as standard.
- Amenity packages that read like boutique hotels: resort pools, demonstration kitchens, co-working suites, package lockers, pet spas, cold plunge and sauna facilities, pickleball courts.
- Unit mixes calibrated for the new renter: larger one-bedrooms with dedicated home offices, “roommate-friendly” two-bedroom layouts, and even three-bedroom units targeting families who rent by choice in high-cost markets.
And the demographic forces keep accelerating. The median age at first marriage has hit an all-time record: 28.6 for women and 30.2 for men as of 2024. Nearly three in four Gen Z renters view renting as a smarter option than buying, per Entrata’s survey data. 59% see it as a long-term choice, not a stepping stone. Home prices remain 40%+ above pre-pandemic levels in most markets, and mortgage rates above 6% have locked out a generation of would-be first-time buyers.
But 2024 brought a reality check. The supply wave hit, vacancy rates climbed to 15-year highs (6.3%), and rents declined roughly 3.5% from their 2022 peak. Starts plunged to 336K — down 37% from the 2022 peak — as the economics of new development deteriorated. The pipeline is contracting sharply, which sets up an interesting dynamic for the back half of the decade.
The Investment Implication
Here’s the punchline for anyone in the multifamily investment business:
The 1970s and 1980s produced an enormous stock of basic-quality apartments in average-to-below-average locations. These communities — now 40 to 55 years old — are the backbone of America’s naturally occurring affordable housing. They are also, by definition, the oldest and most capital-starved segment of the rental market.
The 2010s and 2020s produced a massive stock of luxury apartments in A-locations. As these units age, they’ll filter down and compete more directly with the renovated Class B product that sits between them.
The communities caught in the middle — 1990s and 2000s vintage B-quality product in decent locations — represent a narrowing band of “investable” multifamily. Understanding this secular evolution in what was built, where it was built, and why it was built isn’t just interesting history. It’s the foundation for making better investment decisions today.
Data sourced from U.S. Census Bureau/HUD New Residential Construction reports, FRED (Series HOUST5F), NAHB, RentCafe/Yardi Matrix, Harvard Joint Center for Housing Studies, CoStar, and the American Community Survey.