Key Takeaways:
- The national office vacancy rate was 18.5% in November, following a slight decrease of 90 basis points (bps) year-over-year (Y-o-Y).
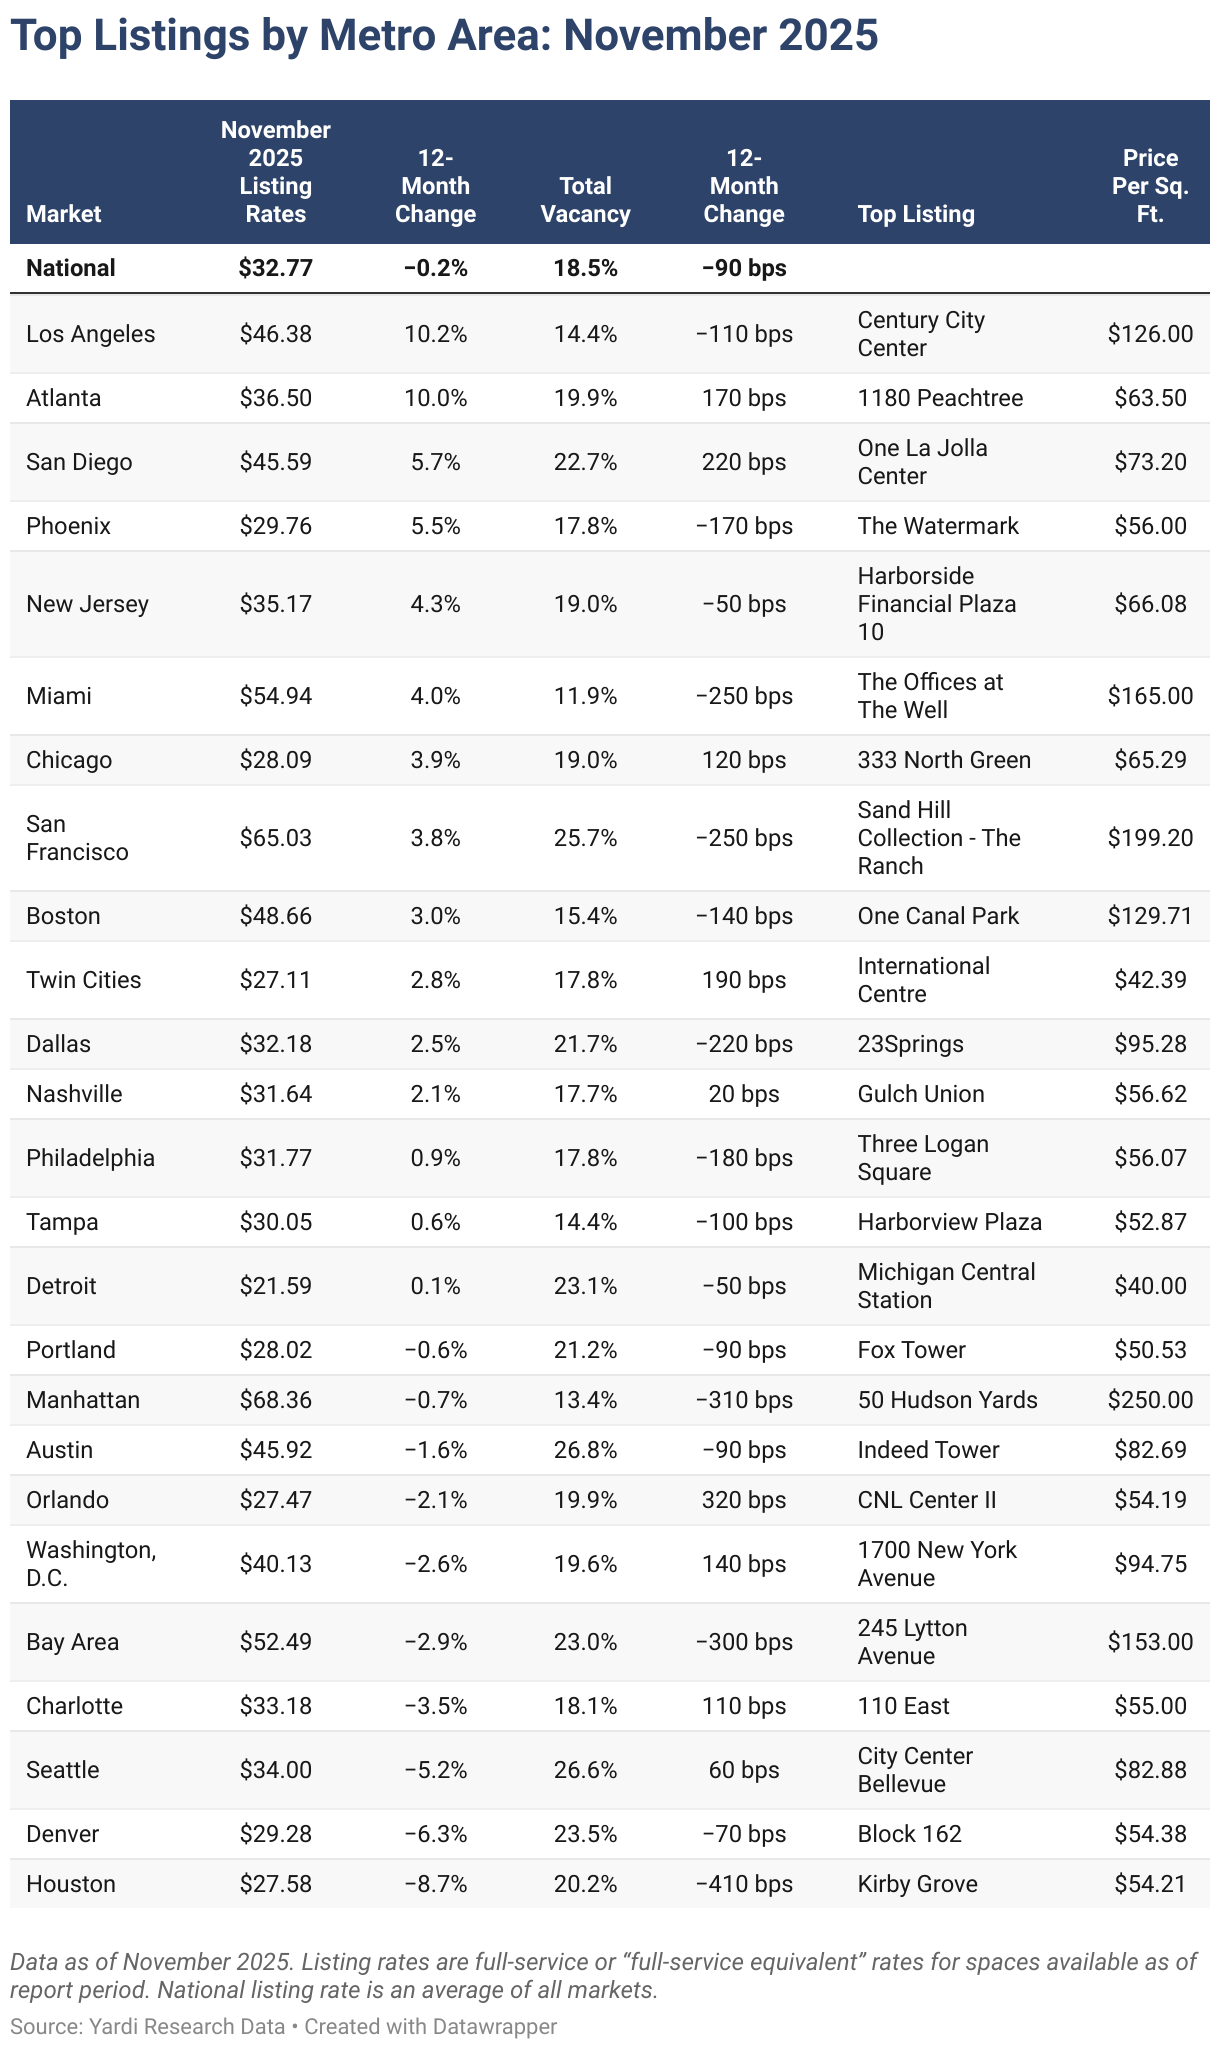
- The national office listing rate averaged $32.77 per square foot in November, which was nearly on par with values recorded 12 months prior.
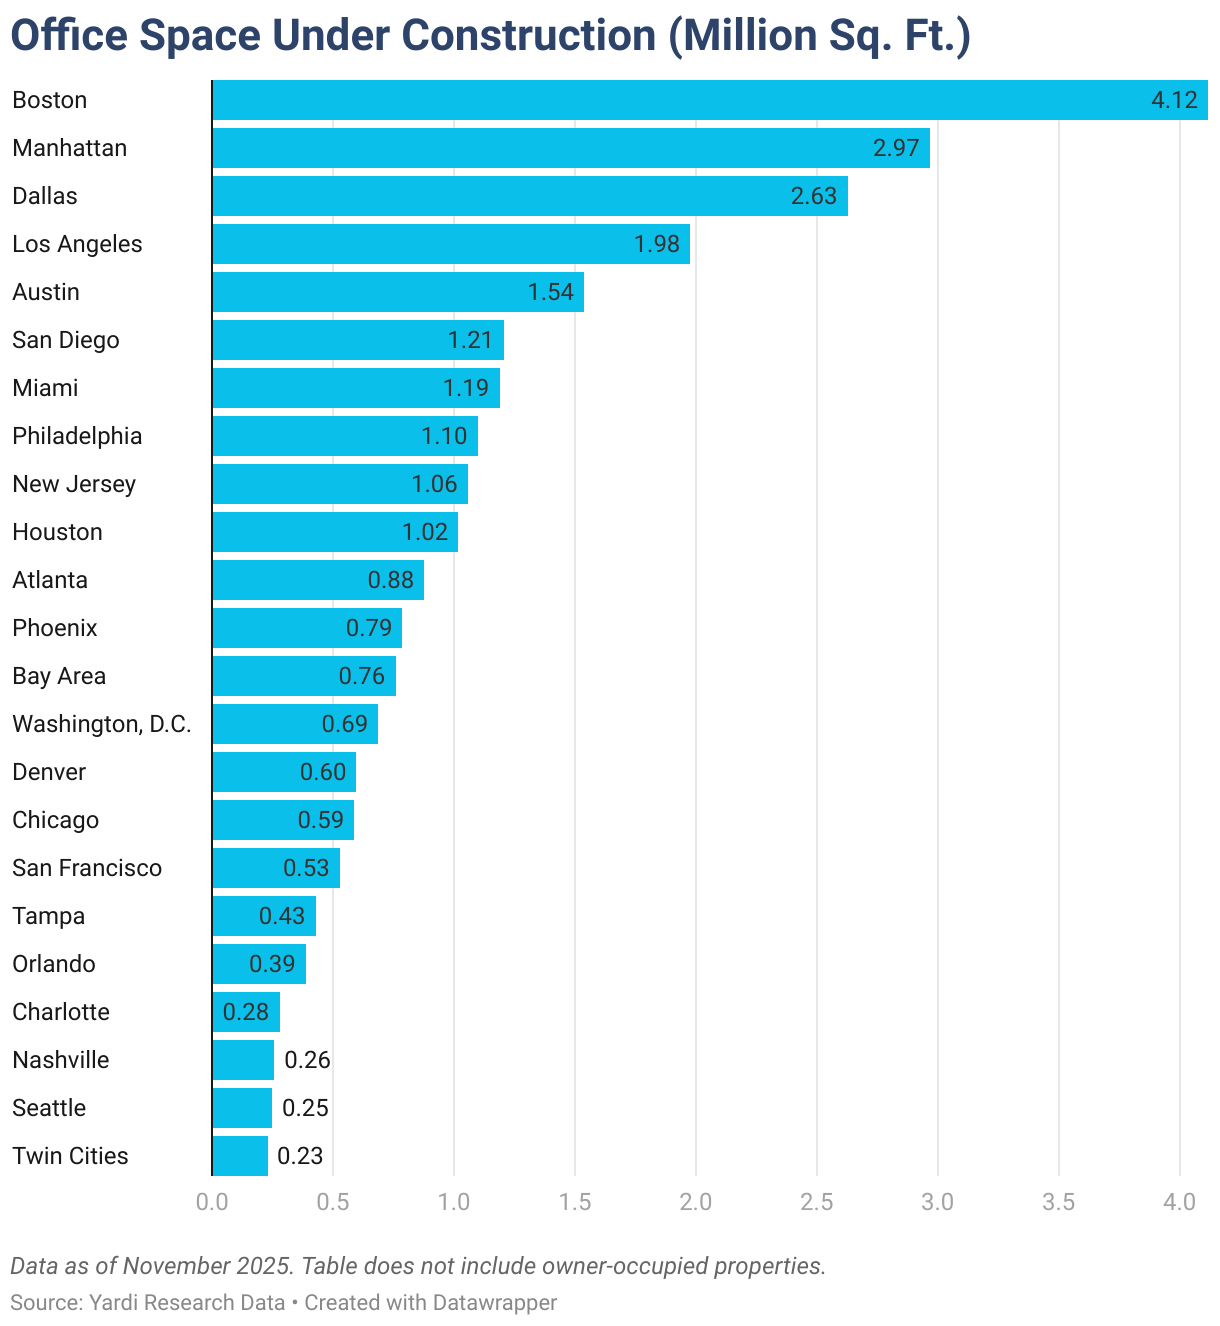
- The office supply pipeline remained modest at the start of December, with a little more than 32 million square feet of office space currently under construction.
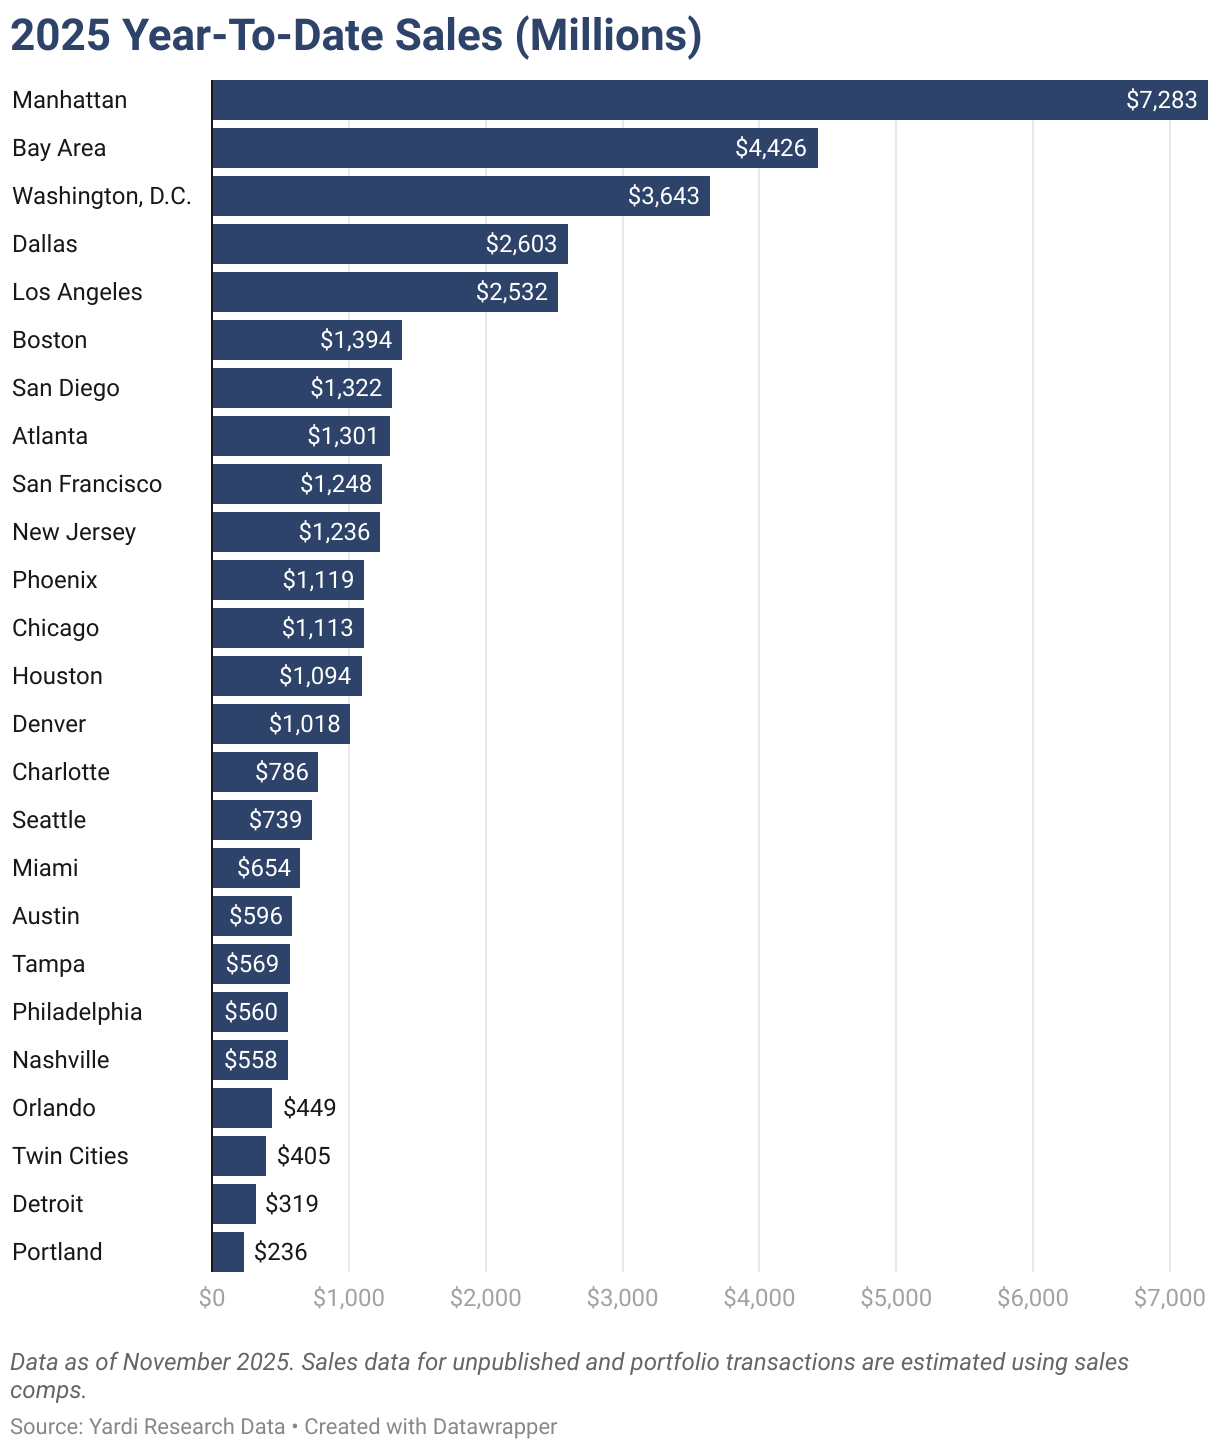
- Manhattan, N.Y., topped the list for year-to-date sales through November with a total of $7.3 billion, followed by the Bay Area ($4.4 billion) and Washington, D.C. ($3.6 billion).
- Manhattan and Los Angeles averaged some of the lowest vacancy rates among top U.S. office markets in November.
- Western and Northeastern markets asked the highest leasing rates, while Midwestern and Southern markets claimed some of the most affordable office asking rates last month.
- Boston; Manhattan, N.Y.; and Dallas had the most active office pipelines and were the only cities to surpass 2 million square feet of new office space under construction in November.
Trends & Industry News
Coworking Grows as Percentage of New Office Stock Continues to Contract Y-o-Y
With more than 13 million square feet of office space starting construction since the start of the year, the supply pipeline continued to shrink in 2025. Now, projects that are in the planning stages or have broken ground represent less than 2% of stock nationally, which marks a slip from 3% a year ago.
What’s more, with employment growth across office-using sectors virtually flat, physical occupancy not increasing in any meaningful way and vacancy only slowly inching down in recent months, new office projects seem increasingly difficult to get off the ground. However, hope lingers in some of the bright spots to emerge in 2025: Namely, Manhattan has been seeing consistently low vacancy and an expanding supply pipeline, while San Francisco experienced significant increases in demand year-over-year.
It’s also worth noting that the slowdown in new office construction does not indicate a stagnant office sector. Rather, coworking has continued to solidify its value and increase its share in the office market. To that end, 22 million square feet of coworking space opened in 2025, which was 16% more than the year before. This marked a 30-bps increase in share of the market to surpass 2%.
Specifically, the structured hybrid model has been increasingly dominant. And, because about two-thirds of firms currently offer location flexibility to their employees, coworking operators are looking at increasing opportunities to fill the gap between fully remote and full-time, in-person office work, while also providing corporate clients an alternative to costly and more rigid office leases.
“While New York City leading the office comeback and the AI sector is driving recent demand in San Francisco and in the Bay Area, office recovery elsewhere has been nuanced and varies greatly city by city and even building by building. Though we are seeing localized winners, the overarching challenge remains the lower physical occupancy rate compared to pre-Covid numbers.”
Peter Kolaczynski, Director, Yardi Research
Listing Rates & Vacancy
Twin Cities Vacancy Shows Effects of Large Tenants Consolidating Out of Underutilized Office Footprints
The national average full-service equivalent listing rate for office space was $32.77 per square foot in November, which followed a slight uptick of 0.2% Y-o-Y. Meanwhile, the national vacancy rate dipped 90 bps compared to the previous year to rest at 18.5% last month.
Of the 25 largest markets we analyzed, 16 saw decreases in their vacancy rates in 2025. While some markets have settled into some stability in occupancy, others have yet to find their footing. So, as economic uncertainty increases and the slowdown in hiring continues, large tenants that find themselves underutilizing a scattered office footprint will tend to consolidate when presented with the right opportunity.
One example of the effects that this can have on the fundamentals of a market is the consolidation of Ameriprise Financial from two buildings in Minneapolis into one. Leaving its nearly 1-million-square-foot headquarters office at the Ameriprise Financial Center in downtown Minneapolis to consolidate operations into a smaller, single building at 901 Third Ave. S. that the company already owns, Ameriprise made a significant dent in tenant occupancy levels. That, in turn, contributed significantly to the vacancy rate increase seen in the Twin Cities market in 2025.
Transactions
Chicago Sale Price Per Square Foot Continues 5-Year Downward Trend
In November, year-to-date office sales exceeded $48 billion across transactions averaging $190 per square foot. Despite continuing to lag behind the peaks of previous office sales booms, the sale price per square foot of office space in the U.S. has been slowly climbing to approach Q2 2020 levels.
Among the 25 top markets we analyzed for this report, Chicago had the lowest year-to-date sale price with an average of $64 per square foot across sales closed here during the first 11 months of the year. According to Yardi Research data, this represented a nearly 28% drop from the year before and marked the fifth consecutive year for price drops in the Illinois market.
Supply
Manhattan, Los Angeles & Phoenix See Office Supply Pipeline Expansions
As of November, roughly 32.2 million square feet of office space was under construction in the U.S. markets we tracked for this report. Yet, according to Yardi Research data, current numbers show a sustained contraction of new office projects: Pipeline totals at the start of December represent 44% fewer square feet under construction than a year before.
While Boston continues to maintain the largest supply pipeline, its 4.1 million square feet currently in development represents less than half of the market’s square footage pipeline from a year ago. In this case, significant funding cuts to National Institutes of Health research have contributed to the decline in investment in the local expansion of life sciences and research institutions that had driven Boston’s construction boom in recent years.
The only three markets to see increases in development activity since the start of the year were Manhattan, N.Y. (10% growth to nearly 3 million square feet), Los Angeles (6% growth to reach almost 2 million square feet), and Phoenix (nearly 800,000 square feet under construction following a 49% Y-o-Y pipeline expansion).
Western Markets
San Francisco & Bay Area Ask Highest Leasing Rates, Los Angeles Dominates Development in Region
Vacancy rates were above the national average of 18.5% in November in the majority of the Western U.S. markets we surveyed for this report. With the exception of Los Angeles (14.4% vacancy) and Phoenix (17.8%), all markets in this group averaged vacancy rates above 20% last month.
Among them, Seattle office space saw the highest vacancy rate in the region, averaging 26.6% in November. Next, San Francisco was again second on this short list with vacancy averaging nearly 26% last month. Then, Denver and California’s Bay Area each had around 23% vacancies in their local office sectors.
With some support from performance across the tech ecosystem around the urban core, asking rents for office space in San Francisco topped the regional list: Rates here averaged a little more than $65 per square foot in November, which was double the national average of close to $33. Nearby, Bay Area office space remained the second-priciest in the region last month with asking rates approaching nearly $52.50 per square foot, on average. The Bay Area was also the only other Western U.S. market on our list where average rates surpassed $50 per square foot in November.
Not to be outdone, Los Angeles (#3) and San Diego (#4) each averaged roughly $46 per square foot and closed out the standout block of California markets at the top of the list for rents.
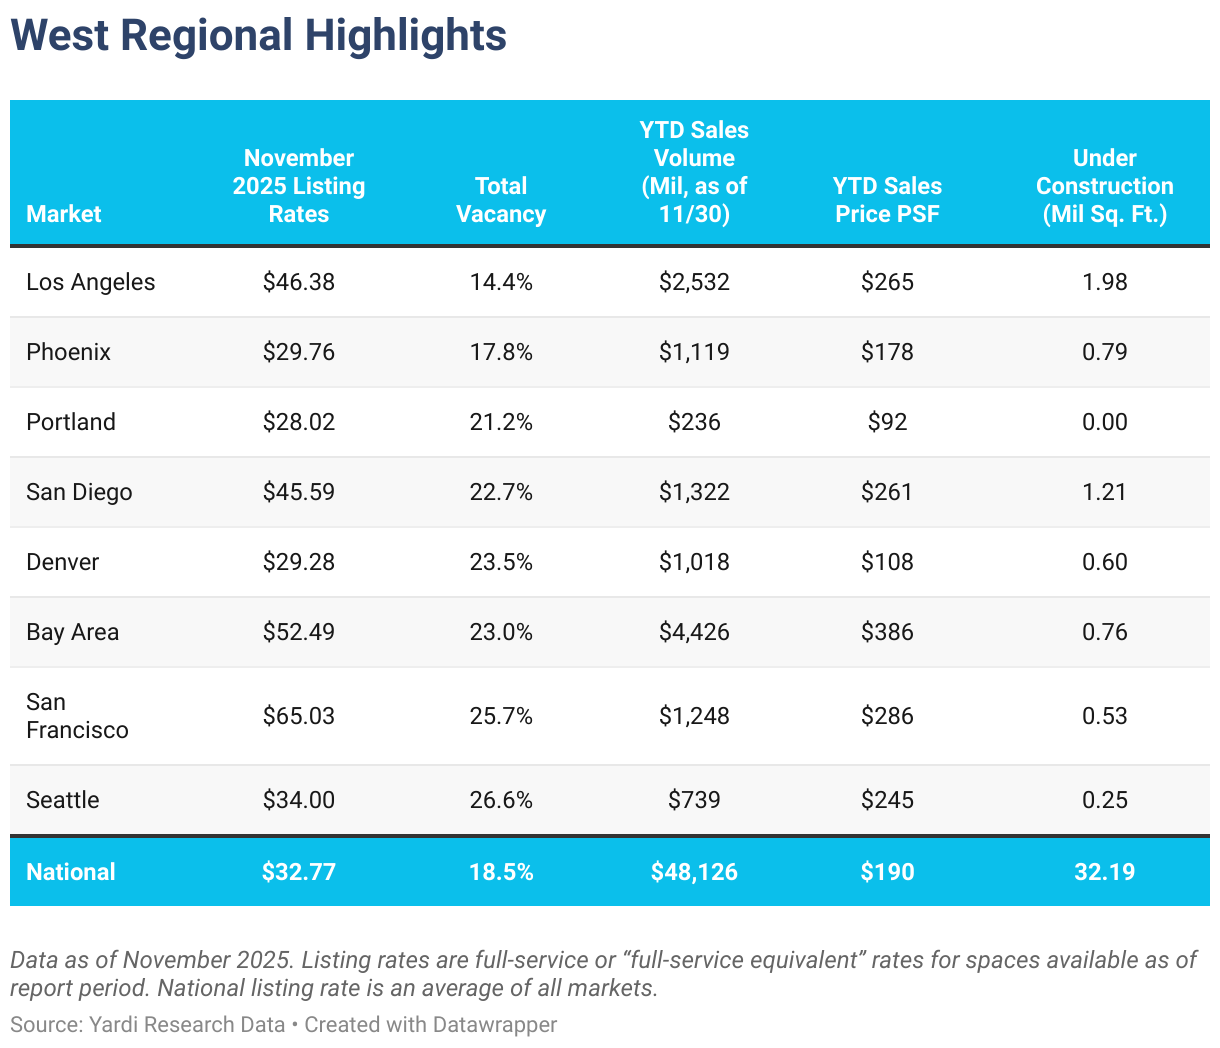
Otherwise, Portland, Ore.; Denver; and Phoenix remained the only large markets in the Western U.S. where office asking rates were below the national average in November. Each landed just below $30 per square foot.
Then, looking at total market office sales in the region, the Bay Area retained its top spot. Transactions closed here since the start of the year amounted to more than $4.4 billion. Further south, Los Angeles office space saw a little more than $2.5 billion in sales closed through the first 11 months of the year. It’s worth noting that San Francisco, San Diego, Phoenix, and Denver were the only other markets in the region to see year-to-date sales surpass $1 billion in November.
During that same timeframe, the Bay Area also stood out for sale prices: Since the start of 2025, office space here commanded the highest average sale price per square foot in the Western U.S. At $386 per square foot, it was the only market in the region where office sales closed for an average price above $300. San Francisco came in second at a $100 distance with year-to-date office sales here averaging $286 per square foot through November.
California markets also led the region in terms of development last month. Specifically, Los Angeles had nearly 2 million square feet under construction, followed by San Diego with roughly 1.2 million square feet. At the start of November, each of the other Western U.S. markets we analyzed had less than 1 million square feet of new office space under construction. Otherwise, Phoenix office space currently in development added up to the third-largest pipeline in the region (790,000 square feet), followed by development in the Bay Area (nearly 760,000 square feet).
Midwestern Markets
Chicago Tops Asking Rates & Sales, but Twin Cities Remains Tightest Occupancy Market
The top Midwestern U.S. office markets we looked at for this report remained some of the most affordable in the country in November, both in terms of average listing rate and for-sale price per square foot.
First, Detroit office space remained the most accessible in this group with asking rents here averaging nearly $22 per square foot. Not far behind, the average asking rate for office space in Minneapolis; St. Paul, Minn.; and the wider Twin Cities submarkets rested at a little more than $27 per square foot, following an increase of about 3% Y-o-Y. Occupancy levels in the Minnesota market last month also kept vacancy at roughly 17.8%, remaining below the national average of 18.5%.
Chicago office space was the priciest in the region last month with asking rents averaging $28 per square foot. At the same time, occupancy levels here averaged a vacancy rate that was slightly above the national average.
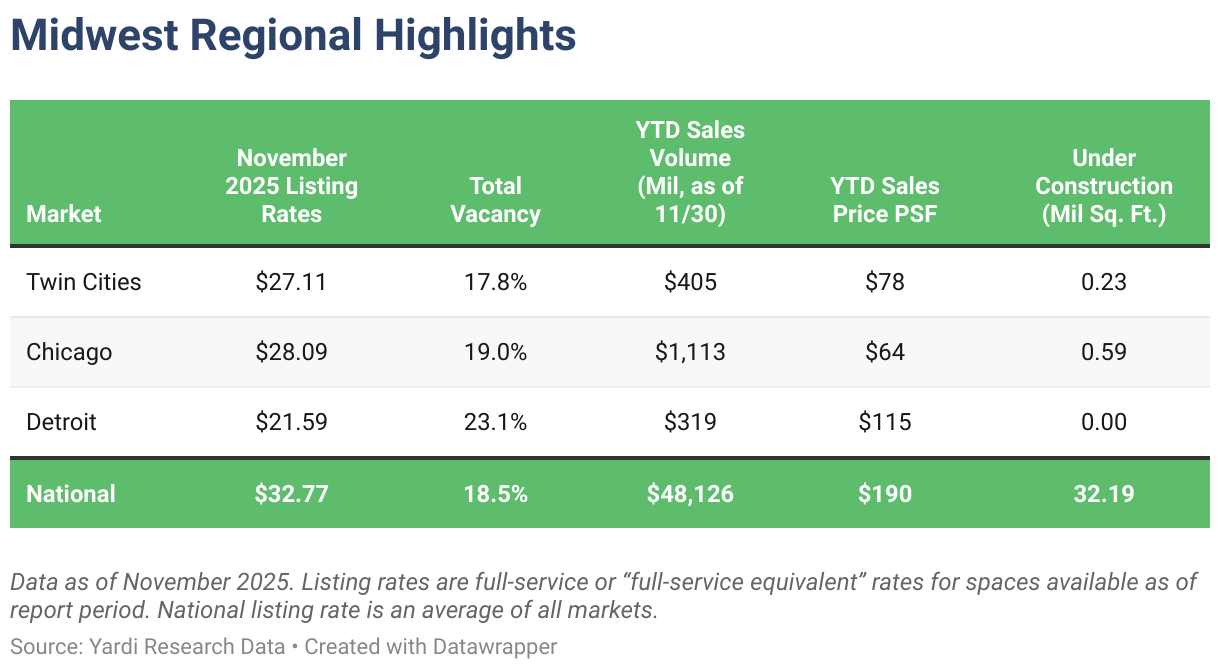
As one might expect, the highest regional year-to-date office sales total in November was in Chicago, which is the largest office market in the region. However, the $1.1 billion worth of office space that sold here since the start of the year changed hands for the lowest price among top markets in the region — an average of $64 per square foot, which was well below the national average of $190.
Additionally, construction in the region cooled significantly by the end of November, with a combined total of less than 1 million square feet of office space under construction across the Midwestern U.S. markets we analyzed. Office projects in progress at the start of December added up to nearly 820,000 square feet.
Southern Markets
Texas Markets Carry Bulk of Development in Region, Miami Commands Highest Lease Rate & Sale Price
In the South, it was Miami; Austin, Texas; and Washington, D.C. that topped the list in terms of asking rents. They were also the only Southern U.S. markets to see full-service equivalent listing rates averaging above $40 per square foot in November. At the other end of the ranking, office space in Orlando, Fla., and Houston had the lowest asking rents in the region, averaging less than $30 per square foot.
Meanwhile, a look at office sales showed that four of the Southern U.S. office markets we analyzed for this report recorded totals higher than $1 billion during the first 11 months of the year. First, Washington, D.C. had the highest year-to-date sales total as office transactions here amounted to nearly $3.6 billion through November. During that time, office space in Washington, D.C. changed hands for an average of $173 per square foot.
Next, Dallas office space sales added up to more than $2.6 billion and represented the second-highest year-to-date total in the region last month. Since the start of 2025, office space in the Texas metroplex changed hands for an average price of $284 per square foot (second only to Miami). To the east, office space in Atlanta was third as transactions closed here this year totaled $1.3 billion through November. Then, back in Texas, year-to-date sales of office space in Houston closed out this group, narrowly surpassing $1 billion in transactions closed during the first 11 months of the year.
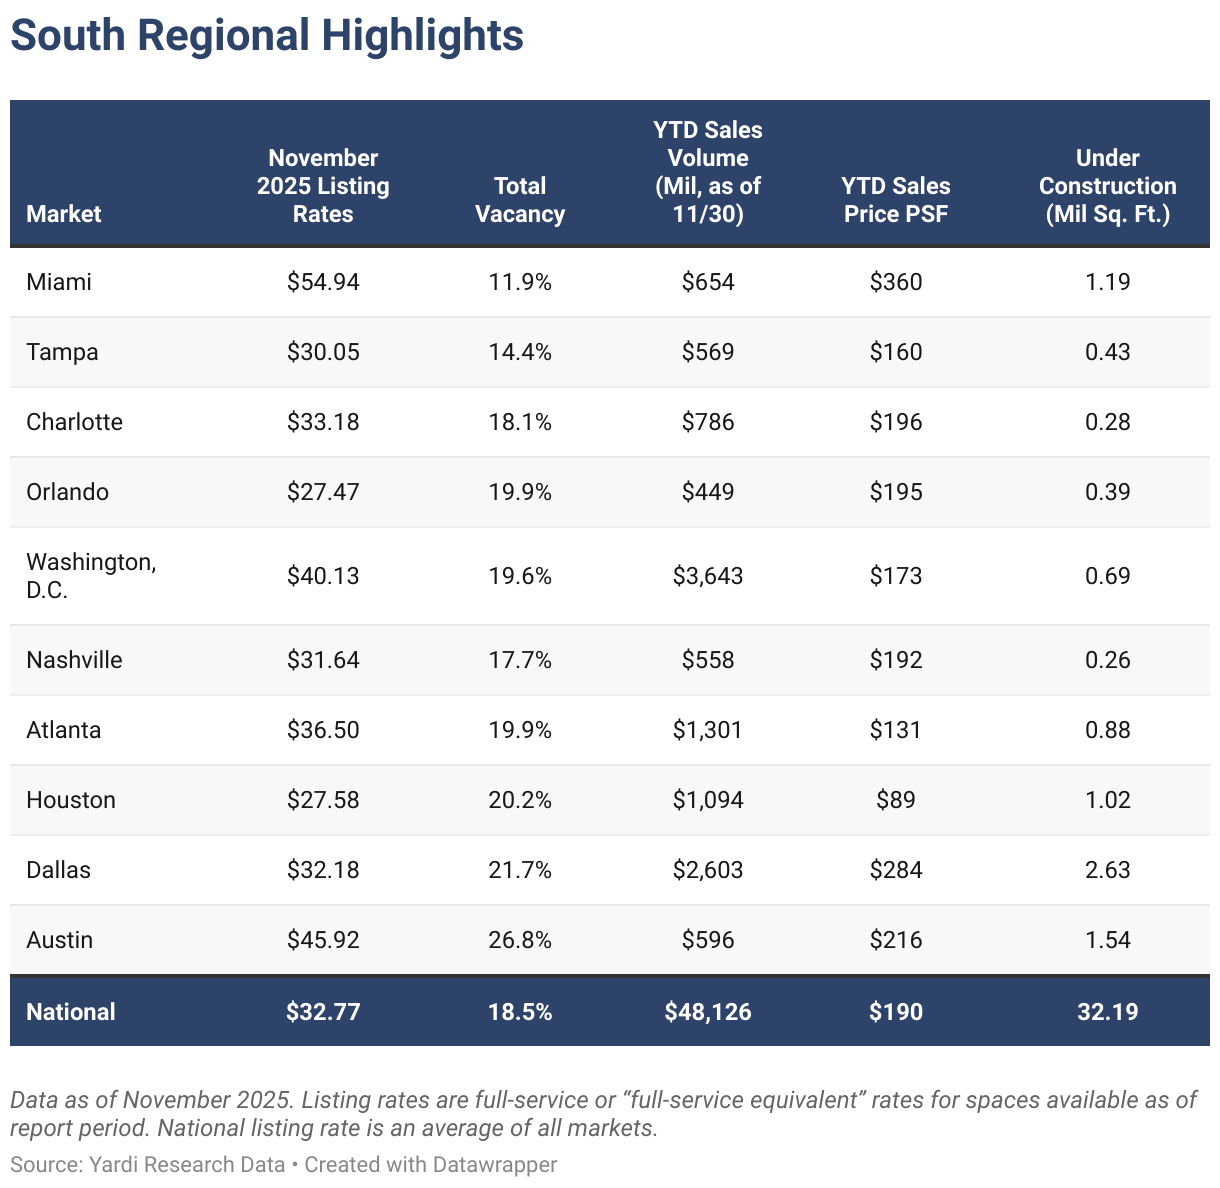
Looking at leasing data, office space in Miami had the highest average full-service equivalent listing rate in the region in November at nearly $55 per square foot. The only two other markets in this regional group to see lease rates average more than $40 per square foot last month were Austin, Texas, and Washington, D.C.: Office space in Austin asked an average of nearly $46 per square foot, whereas asking rates for Washington, D.C. office space averaged $40 per square foot in November.
Notably, Austin also had the highest vacancy rate in the region last month (approaching 27%), followed by Dallas (nearly 22%). Staying in the Lone Star State, Houston was the only other Southern U.S. market in our analysis to see vacancy higher than 20% last month.
As for construction, data showed that the three most popular Texas markets also carried most of the office pipeline in the region: In November, more than 2.6 million square feet of office space was in development in Dallas, and a little more than 1.5 million square feet was under construction in Austin.
Stepping outside of Texas for a moment, the third-most productive in this respect was Miami, the only other Southern U.S. market with more than 1 million square feet underway. Likewise, Houston (home to the fourth-largest pipeline in the region) had roughly 1 million square feet of office space in development last month. Together, office development in these four markets accounted for nearly 20% of the national development pipeline total at the start of December.
Northeastern Markets
Boston & Manhattan Pipelines Account for 22% of National Construction Total
In November, Manhattan, N.Y., had the highest listing rates in the region at roughly $68 per square foot, on average. Boston followed as the second-priciest listing market in the Northeast with asking rates here averaging close to $49 per square foot last month.
At the same time, asking rents for Philadelphia office space were nearly $32 per square foot, marking the only Northeastern U.S. office market to ask less than the national average of nearly $33 per square foot last month.
Looking at construction, Boston and Manhattan again trade ranking places: The Massachusetts market led supply in the region as office projects in development here totaled a little more than 4.1 million square feet last month. In this metric, the Manhattan, N.Y., office space pipeline was the second-largest in the region in November with close to 3 million square feet under construction. Combined, these two Northeastern U.S. markets accounted for about 22% of the national pipeline, which added up to roughly 32 million square feet in November.
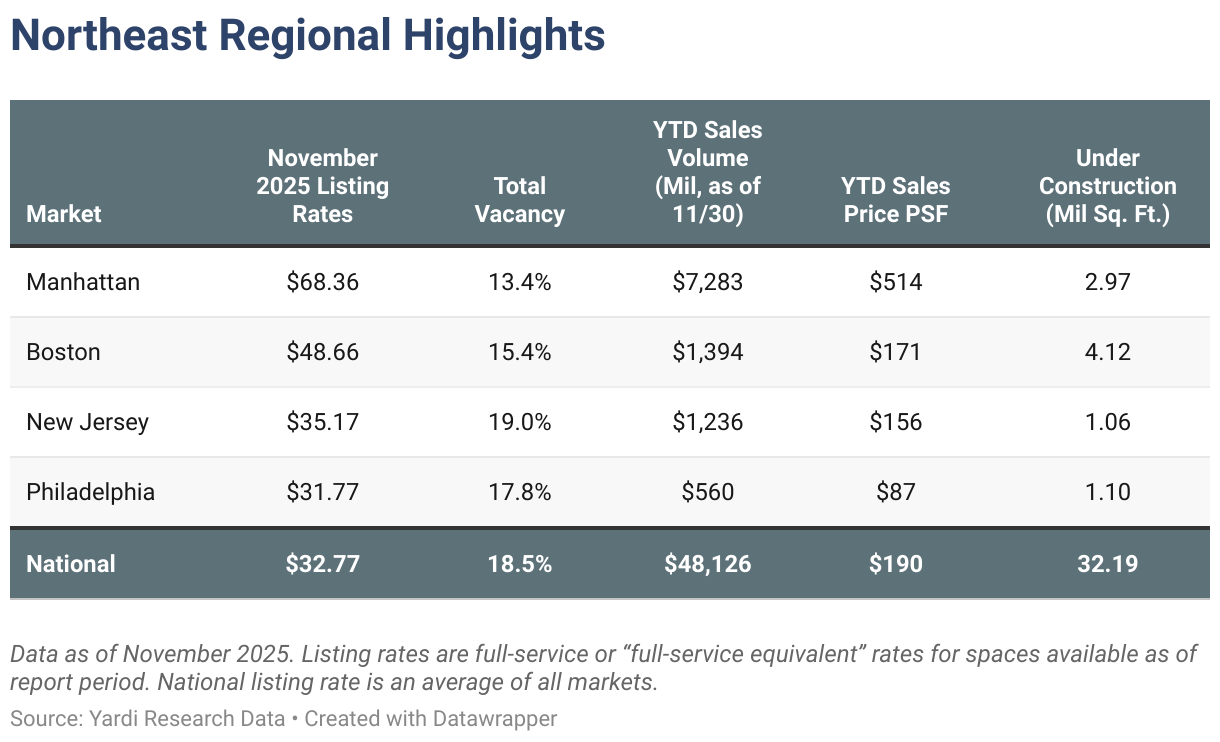
Boston and Manhattan, the two largest markets in the region, swapped positions yet again when considering office sales: Transactions in Manhattan since the start of the year added up to nearly $7.3 billion through November — the largest year-to-date sales total both in the region and in the country. During those 11 months, office properties in the Big Apple traded for an average of $514 per square foot. This was nearly triple the national average of $190 per square foot and placed the New York market comfortably ahead of the rest for priciest office market in the country.
Then, Boston and New Jersey had the second- and third-largest year-to-date sales totals, respectively, following Manhattan at quite a distance in the Northeastern U.S. region. Sales of Boston office space since the start of the year added up to nearly $1.4 billion and averaged $171 per square foot, whereas transactions of office space in New Jersey tallied a little more than $1.2 billion through November at an average sale price of $156 per square foot.
Office-Using Employment
Jury Still Out on Industries & Jobs Being Erased by AI
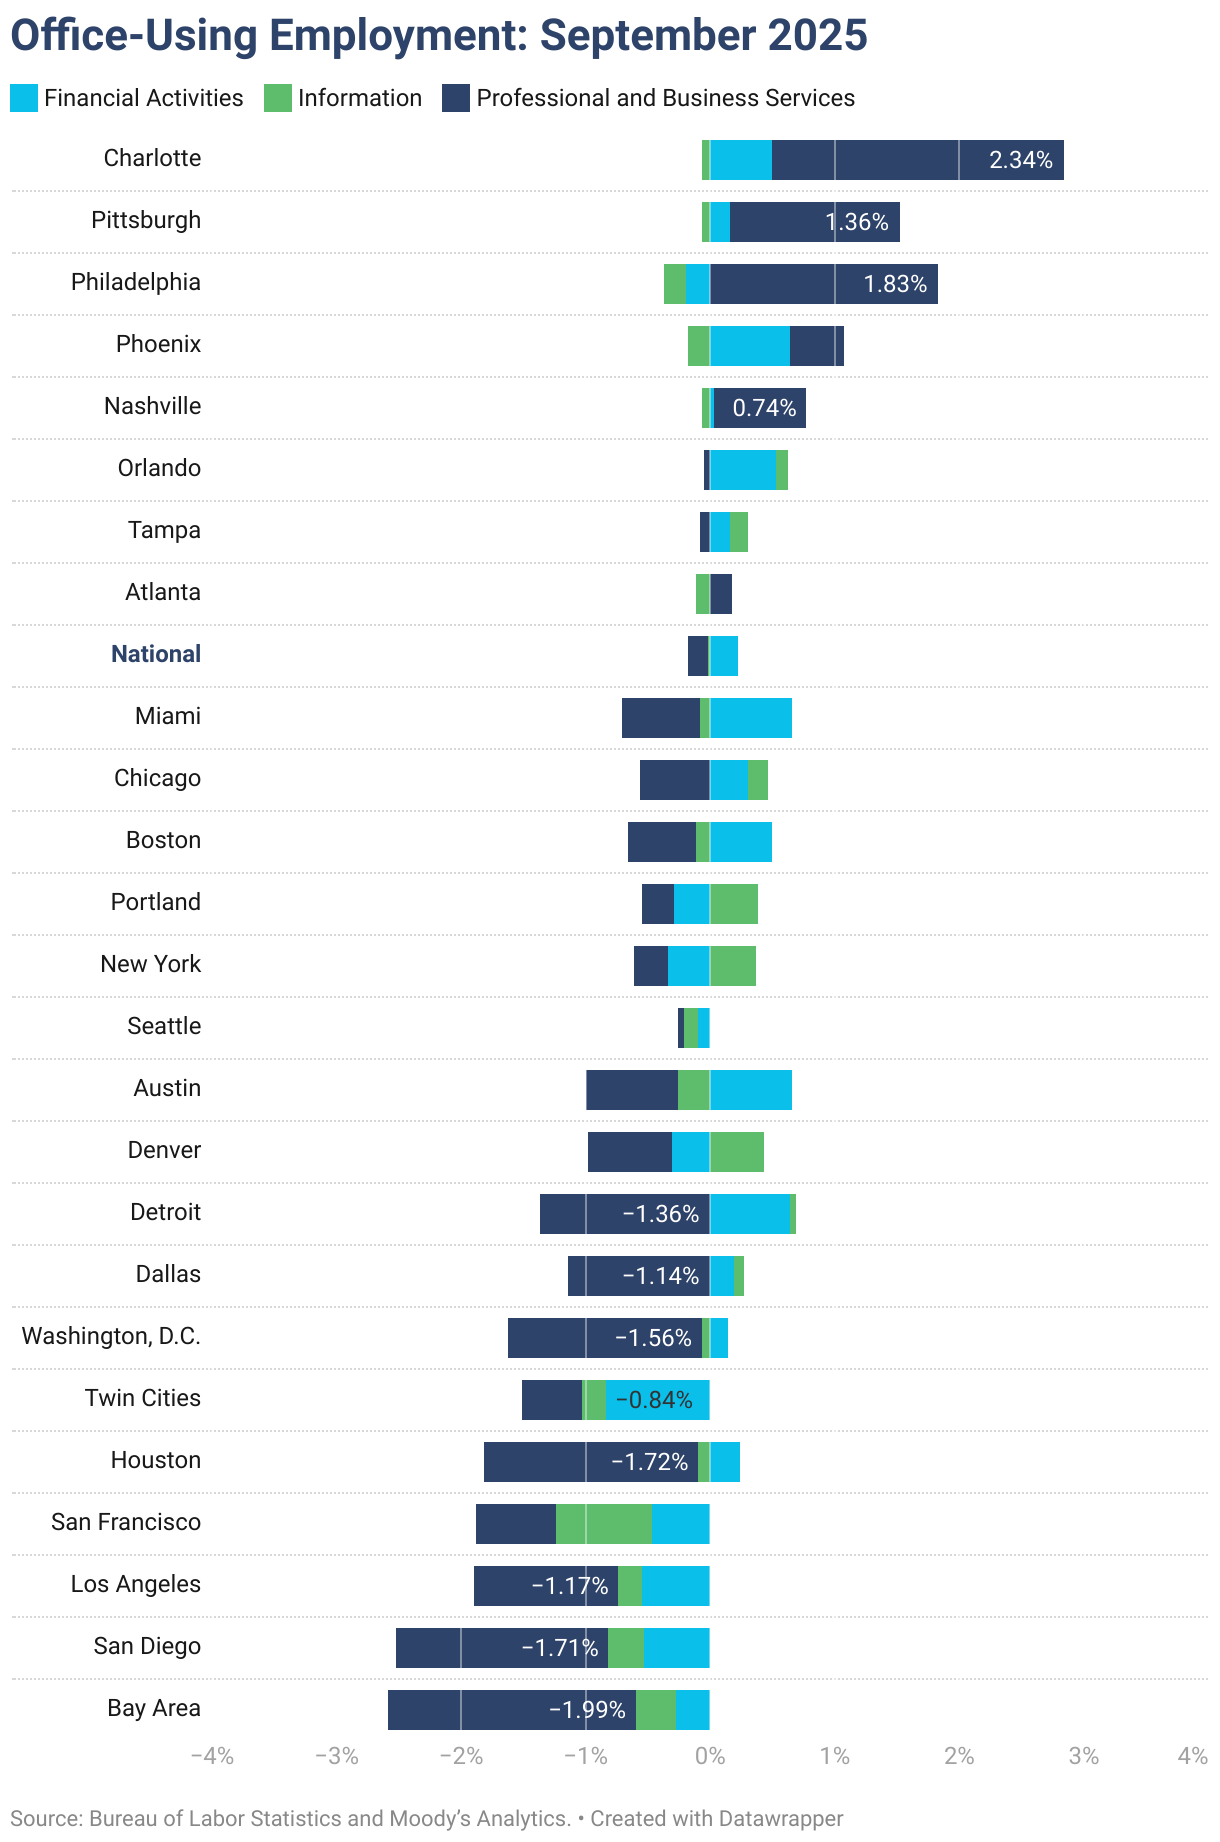
Finally, although the release of employment data from the Bureau of Labor Statistics was delayed once again due to the government shutdown, we can rely on private-sector employment research to fill in some of the gap.
To that end, ADP data showed that employment in office-using sectors declined by a combined 30,000 jobs in October, led by losses in professional and business services, as well as in the information sector. At the same time, financial activities gained 10,000 jobs. Looking at labor data year-over-year, office-using sectors overall gained about 188,000 jobs, which marked a modest 0.5% increase in 12 months.
That said, data on the effects of developments in artificial intelligence on the labor market points to a future that may not be as somber as it’s currently being made out to be. For instance, a New York Fed survey conducted last year captured that about 13% of service firms were anticipating workforce reductions due to AI in 2025, but a recent repeat of the same survey found that only about 1% of service firms reported actually downsizing personnel due to AI. The survey also indicated a greater likelihood of workers receiving new training in the technology, rather than being replaced by it.
Methodology
This report covers office buildings that are 25,000 square feet or larger. Listing rate and occupancy information was based on Yardi Research data.
Listing rates are full-service rates or “full-service equivalent” for spaces that were available as of the report period.
Vacancy refers to the total square feet vacant in a market (including subleases) divided by the total square feet of office space in that market. Owner-occupied buildings are not included in vacancy calculations. For reporting purposes, A and A+/trophy buildings were combined.
Stages of the supply pipeline:
Planned — Buildings that are currently in the process of acquiring zoning approval and permits, but have not yet begun construction.
Under Construction — Buildings for which construction and excavation has begun.
Office-Using Employment is defined by the Bureau of Labor Statistics as including the sectors Information, Financial Activities, and Professional and Business Services. Employment numbers are representative of the Metropolitan Statistical Area and do not necessarily align exactly with CommercialCafe market boundaries.
Sales volume and price-per-square-foot calculations for portfolio transactions or those with unpublished dollar values were estimated using sales comps based on sales that were similar in terms of the market and submarket; use type; location and asset ratings; sale date; and property size.
Market boundaries in the CommercialCafe office report coincide with markets defined in the CommercialCafe Markets Map and may differ from regional boundaries defined by other sources.
Fair Use & Redistribution
We encourage and freely grant you permission to reuse, host, or repost the research, graphics, and images presented in this article. When doing so, we kindly ask that you credit our research by linking to CommercialCafe.com or this page so that your readers can learn more about this project, the research behind it, and its methodology. For more in-depth, customized data, please contact us at prinfo@commercialcafe.com.
The post Coworking Captures Opportunity as National Office Pipeline Continues to Shrink appeared first on CommercialCafe.