
The New AI Trade: 3 Stocks Powering the Next Leg

It’s still early innings in the AI supercycle, but the bottleneck has shifted. Last year it was all about semiconductors and NVDA, but that came to a screeching halt with the Deepseek launch.
Now it’s all about electrons. Whoever controls the power controls the outcome of the AI arms race.
It’s why nuclear has been a hot trade, like in OKLO:
But it’s going to take time to get nuclear up and running, even if it’s of the “small, modular” variety.
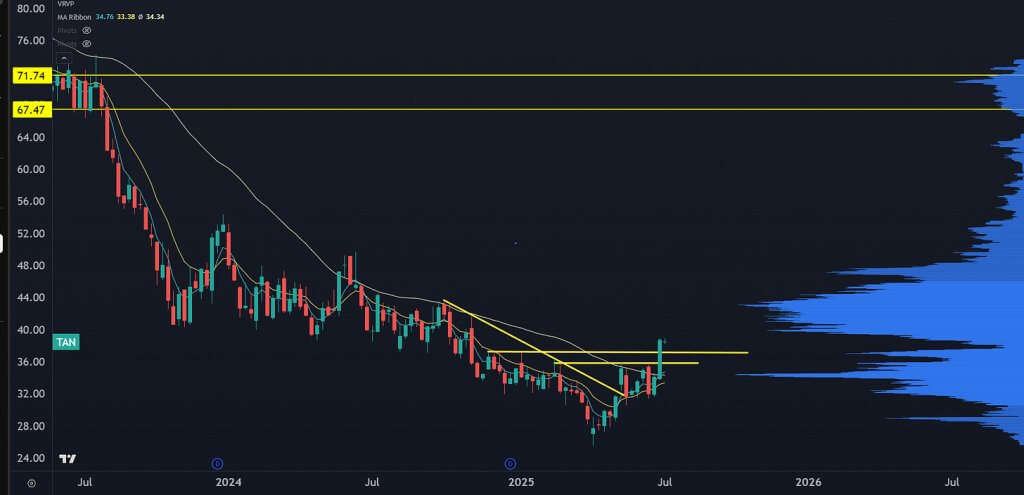
It’s easier to roll out solar farms.
With AI power demand, solar can stand on its own without subsidies. The market is beginning to respond. Here’s a look at a reversal pattern setup in TAN:
Because solar is intermittent, you’ll need batteries. Most of these stocks are dead in the water as they were a busted EV trade but are starting to show signs of life again. Here’s QS, a former high flyer that’s up 100% on news:
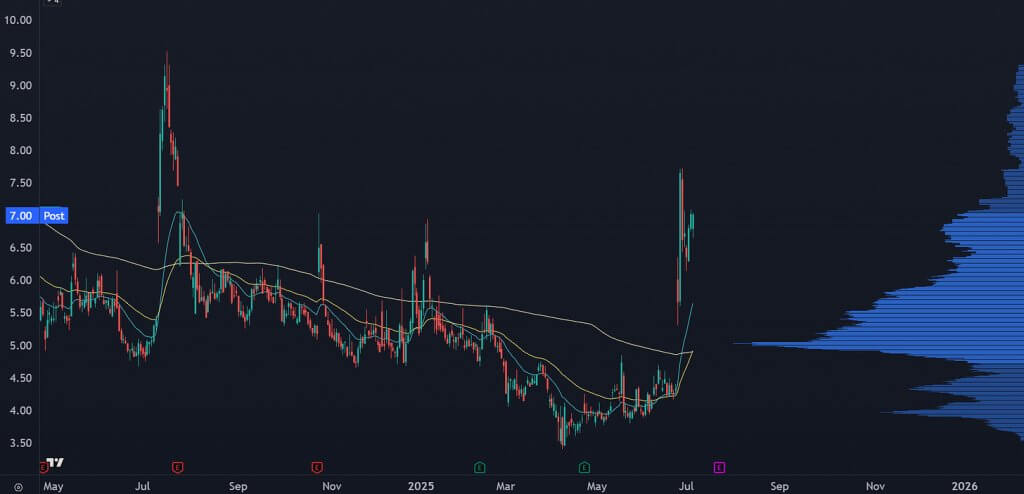
Many of these stocks are stuck in dilution hell and can’t sustain a bid as they’re itching to dump shares onto the market.
Yet it’s early in this space.
The New Robin Hood
A top momentum flyer has been HOOD, and there’s a stock exhibiting the same “sticky” pattern.
When a stock gets “overbought,” owners should take their profits and late buyers get punished.
But sometimes it gets sticky, and that’s a signal.
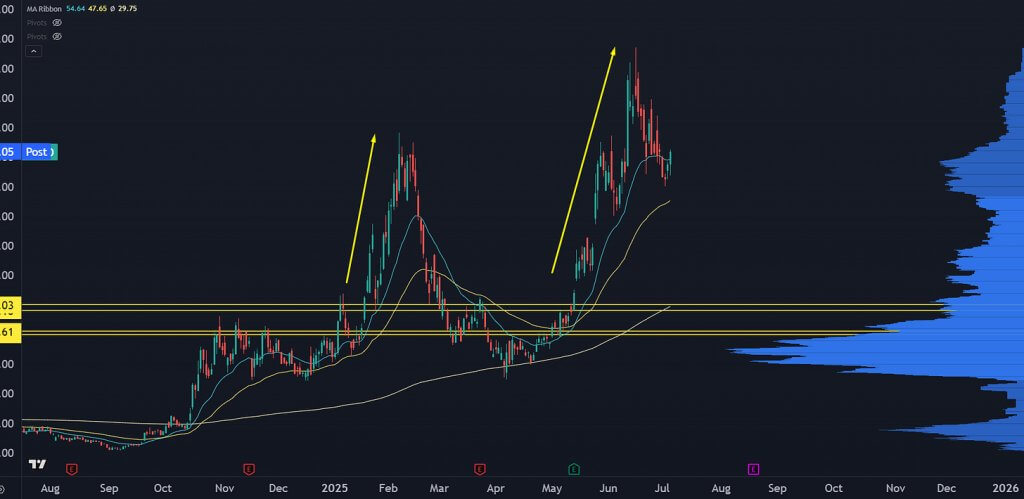
Like what we are seeing in RKLB:
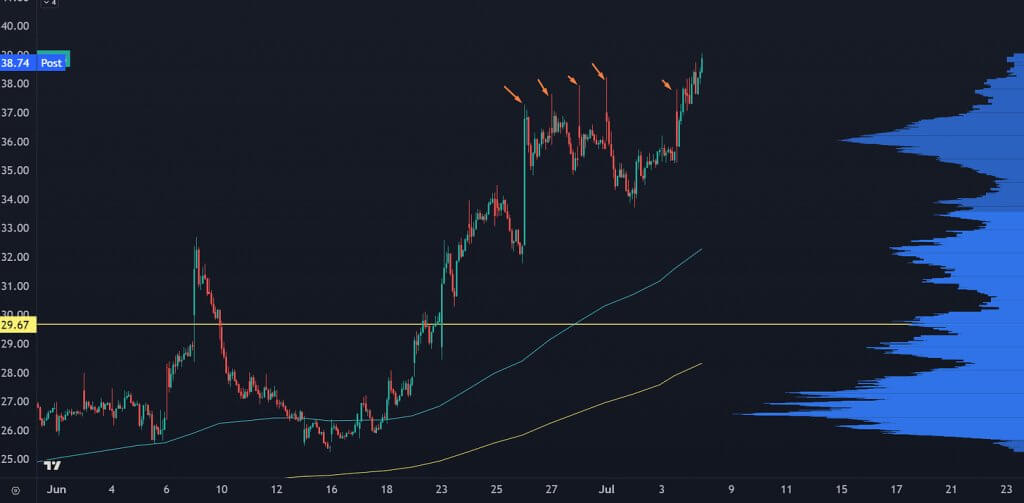
The stock is “overbought,” and sellers show up into any push above $37. We see that again today, but by lunch the stock has reclaimed $37 and finished at day highs.
Continued holds of $37 and we’re looking at a parabolic extension with potential into $50.
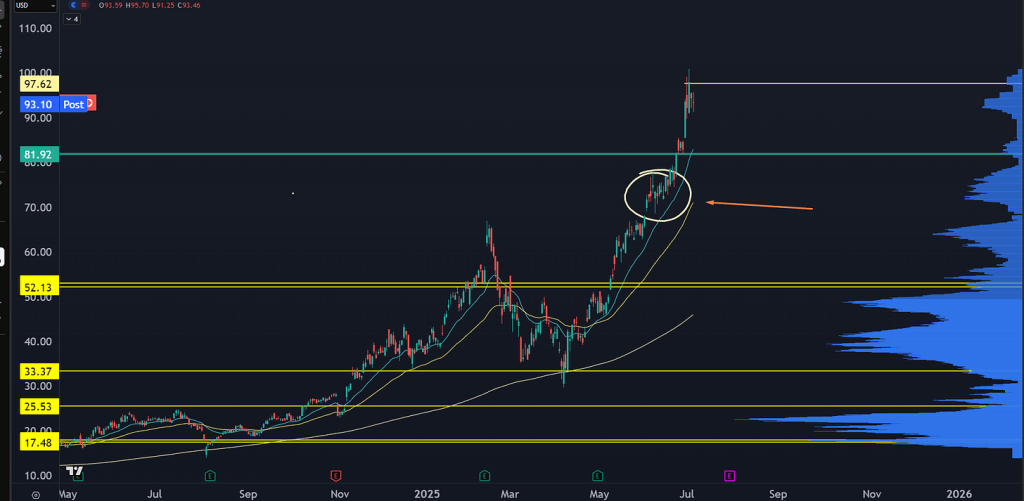
I also just sent a buy alert on a former high-flying momentum stock that recently pivoted into AI. The beta for the software just came out, so the hype behind the launch could show up as Wall Street discovers another company with an “AI Layer Value Unlock” – similar to what happened with RBLX:
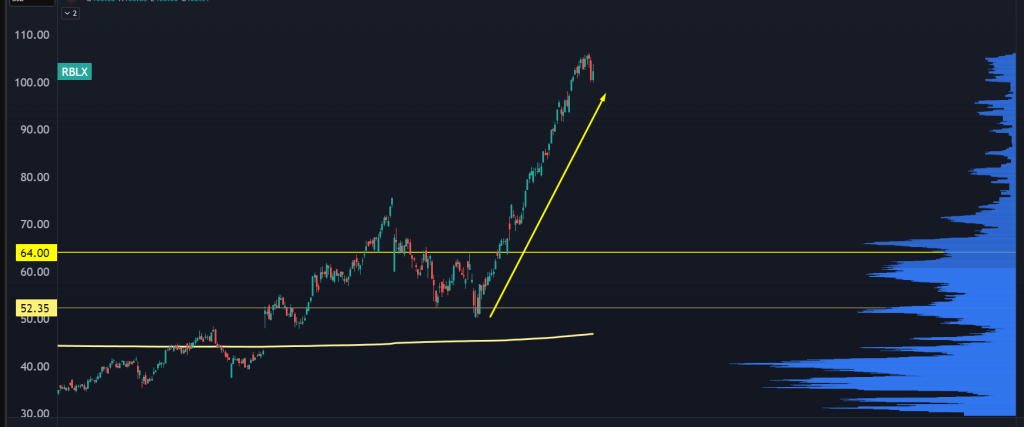
Based on those factors plus a new point of control developing (that blue histogram you see on the right side of the chart above), I believe this stock has serious upside. I explained more in a recent live training – take a look right here.


