


Traders Workshop – For Real Success – You Need To Learn From The Best!
Complete Trading School by Vladimir Ribakov

Hi Traders! Arvinth here from the Home Trader Club team. The weekly summary and, review of July 11th 2025 is here. It is now time to recap and summarize the trade setups that we had during this week. Below you will find a short explanation of all the trade setups we had this week and how it has currently developed now.
Explore My Free Mentorship Program
As an Internationally Certified Financial Technician (CFTe, IFTA) and former private capital hedge fund trader, I have successfully mentored numerous students who are now thriving in the trading world. Students who learned with me, are now full-time traders, work in the trading industry, run their own capital firms or are fully funded traders by private companies, develop automated trading solutions and manage others’ capitals. I am a very proud mentor and I am proud of the success stories I’ve helped create, and for a limited time, I’m offering my mentorship program for free through a partnership with Eight Cap broker. Join Eight Cap, become an active trader, and choose the offer that suits you best –

For more details, visit: Home Trader Club Mentorship Program
I’m excited to work with you and help you reach your desired level of success!
Trading Ideas (Blog Posts)
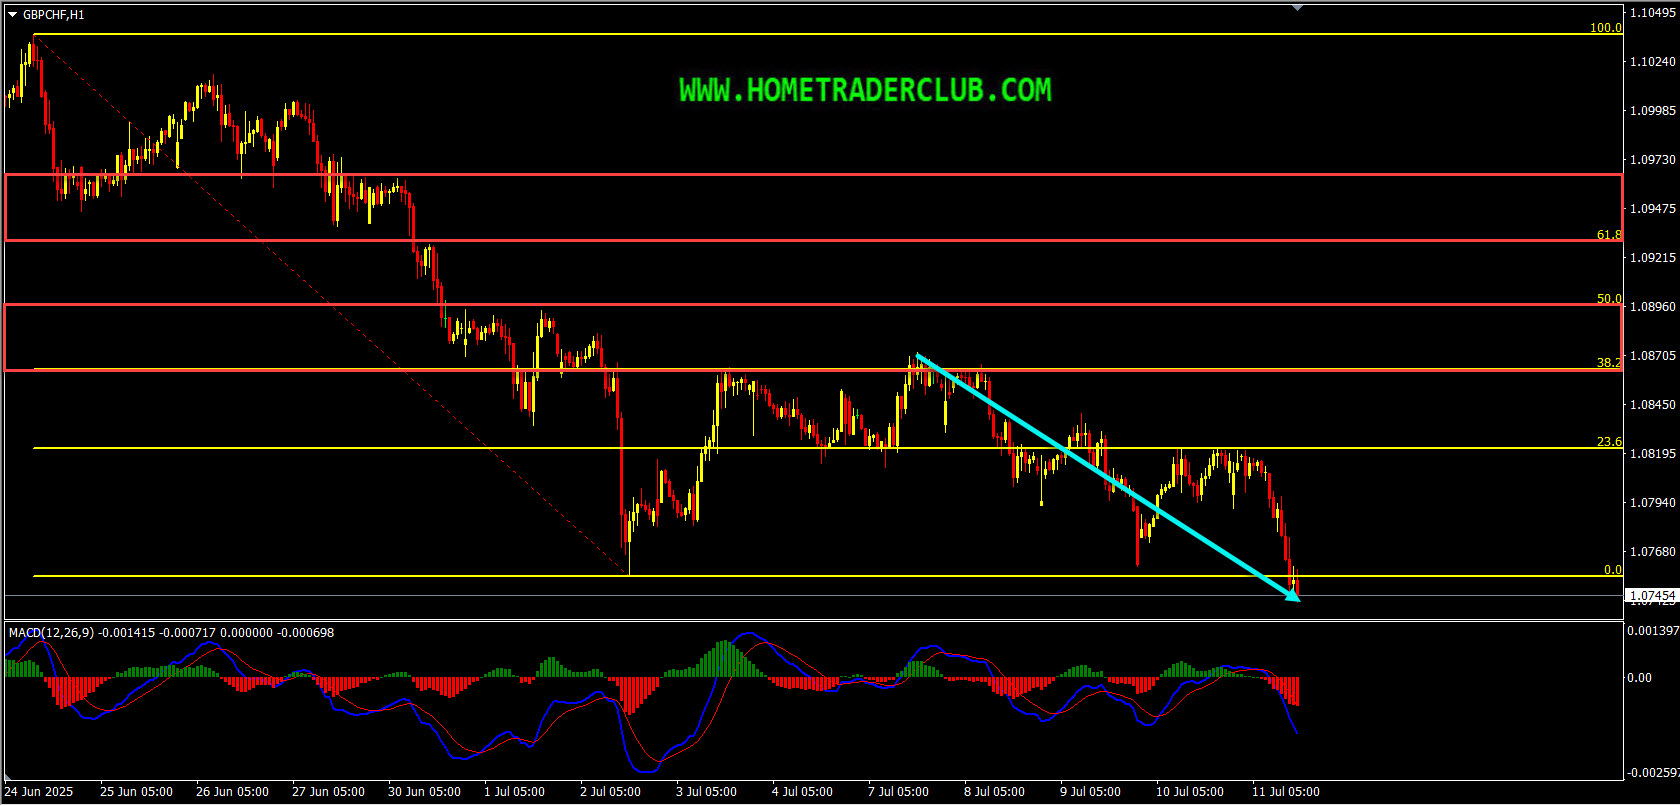
GBPCHF – My idea here was “On the H1 chart, we could see that currently we have a strong bearish momentum here as well. Also while measuring this strong bearish move we have two key resistance zones that has formed. The first key resistance zone is formed based on the 38.2%(1.08633) – 50%(1.08967) Fibonacci retracement levels of the strong bearish move. The second key resistance zone is formed based on the 61.8%(1.09302) Fibonacci retracement level of the strong bearish move. Until both these key resistance zones shown in the image below (marked in red) holds my short term view remains bearish here and I expect the price to move lower further after pullbacks”.

Current Scenario – In GBPCHF, based on the above-mentioned analysis, until the two key resistance zones hold I was expecting short term bearish moves to happen here. The price action followed my analysis exactly as I expected it to here. The pullback that I was looking for happened with the price reaching the first key resistance zone, respected it moved lower and delivered a nice move to the downside!
GBPCAD – My idea here was “On the H1 chart, we could see that currently we have a strong bearish momentum here as well. Also while measuring this strong bearish move we have two key resistance zones that has formed. The first key resistance zone is formed based on the 38.2%(1.86288) – 50%(1.86625) Fibonacci retracement levels of the strong bearish move. The second key resistance zone is formed based on the 61.8%(1.87022) Fibonacci retracement level of the strong bearish move. Until both these key resistance zones shown in the image below (marked in red) holds my short term view remains bearish here and I expect the price to move lower further after pullbacks”.

Current Scenario – In GBPCAD, based on the above-mentioned analysis “Until both these key resistance zones shown in the image below (marked in red) holds my short term view remains bearish here and I expect the price to move lower further after pullbacks”. The price action followed my analysis exactly as I expected it to here. We had a pullback and then the price moved lower and has delivered a nice move to the downside!

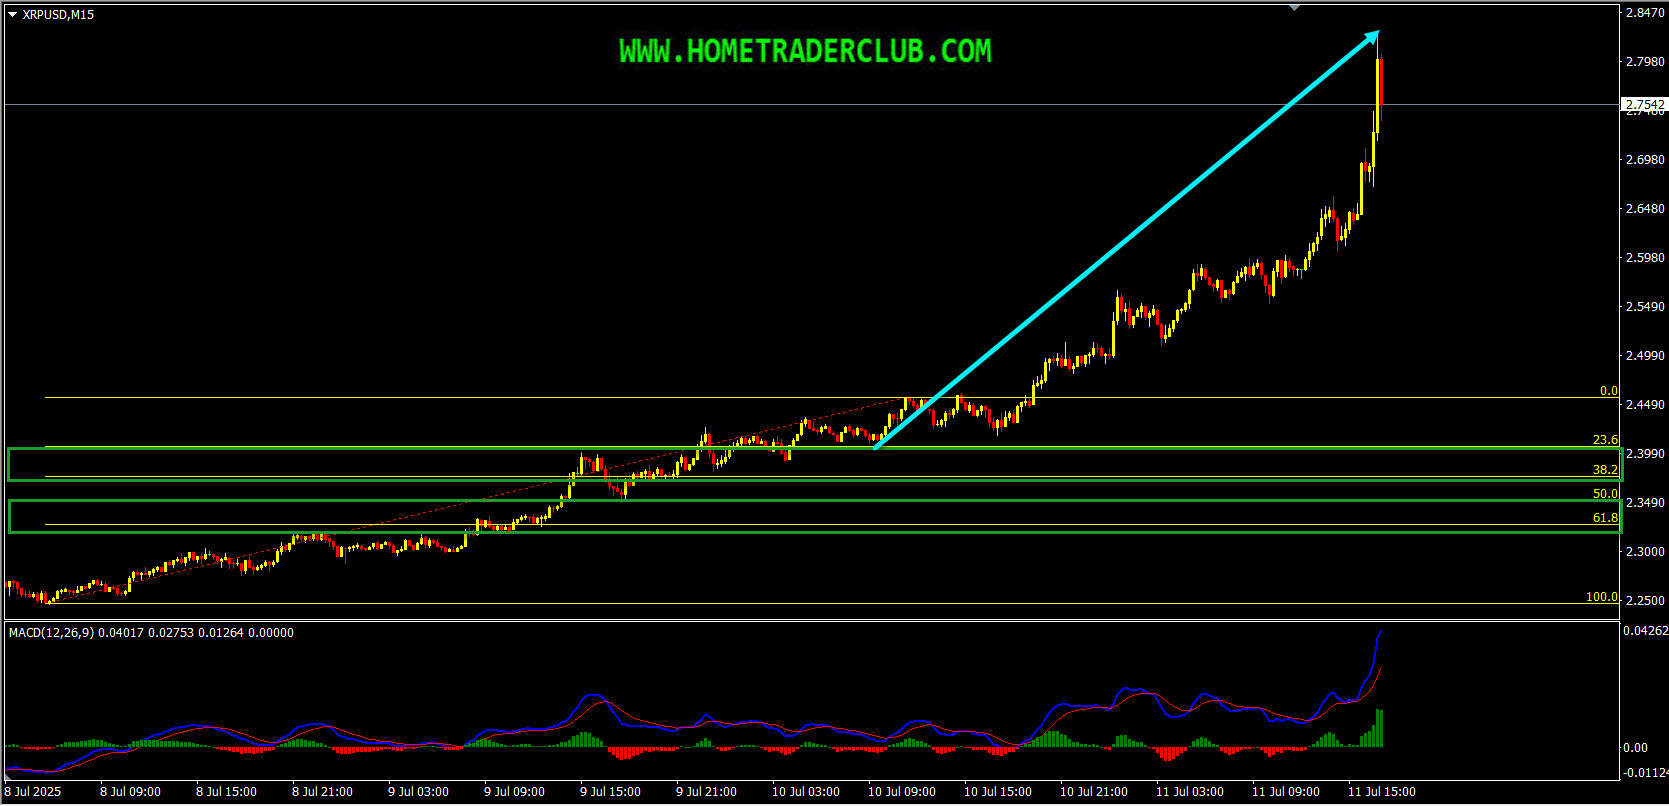
Ripple – My idea here was “On the M15 chart, we have a strong bullish momentum here and also currently there are no signs opposing this short term bullish view. Also while measuring this strong bullish move we have two key support zones that has formed. The first key support zone is formed based on the 23.6%(2.4068) – 38.2%(2.3760) Fibonacci retracement levels of the strong bullish move. The second key support zone is formed based on the 50%(2.3511) – 61.8%(2.3263) Fibonacci retracement levels of the strong bullish move. Until both these key support zones shown in the image below (marked in green) holds my short term view remains bullish here and I expect the price to move higher further after retraces”.

Current Scenario – In Ripple based on the above-mentioned analysis “until both the key support zones hold my short term view was bullish here and I expected the price to move higher further ”. The price action followed my analysis here, moved higher as I expected it to and provided a nice move to the upside!
For similar trade ideas and much more I invite you to join the Home Trader Club and improve your trading with us.
You will also find a pretty extensive database of educational materials here in the blog – just use the search or check out the Forex Education section above.
If you have any further questions, don’t hesitate to drop a comment below!
Happy Trading!
Arvinth Akash
Home Trader Club Team.
Advertisement


