Hi friends! Happy Friday! How are you? What are you up to this weekend?
We’re going to see the lights at the Botanical Gardens and also headed to the Princess next week; I can’t wait. It definitely makes me feel like the holidays are here. I’d love to hear what you have going on!

For now, it’s time for the weekly Friday Faves party. This is where I share some of my favorite finds from the week and around the web. I always love to hear about your faves, too, so please shout out something you’re loving in the comments section below.
12.19 Friday Faves
Fashion, beauty, random:
We had so many fun events this past week. It was a friend’s birthday dinner, I had dinner at a friend’s house (she made amazing salads and we just hung out and chatted) and we had a holiday party for charity organization that the Pilot belongs to. It’s our first year and everyone was so welcoming and lovely.

(I had a huge outfit scramble but ended up wearing this! We don’t have a Nordstrom here in Tucson – major sad face – but I can usually find good stuff last-minute at Dillard’s)
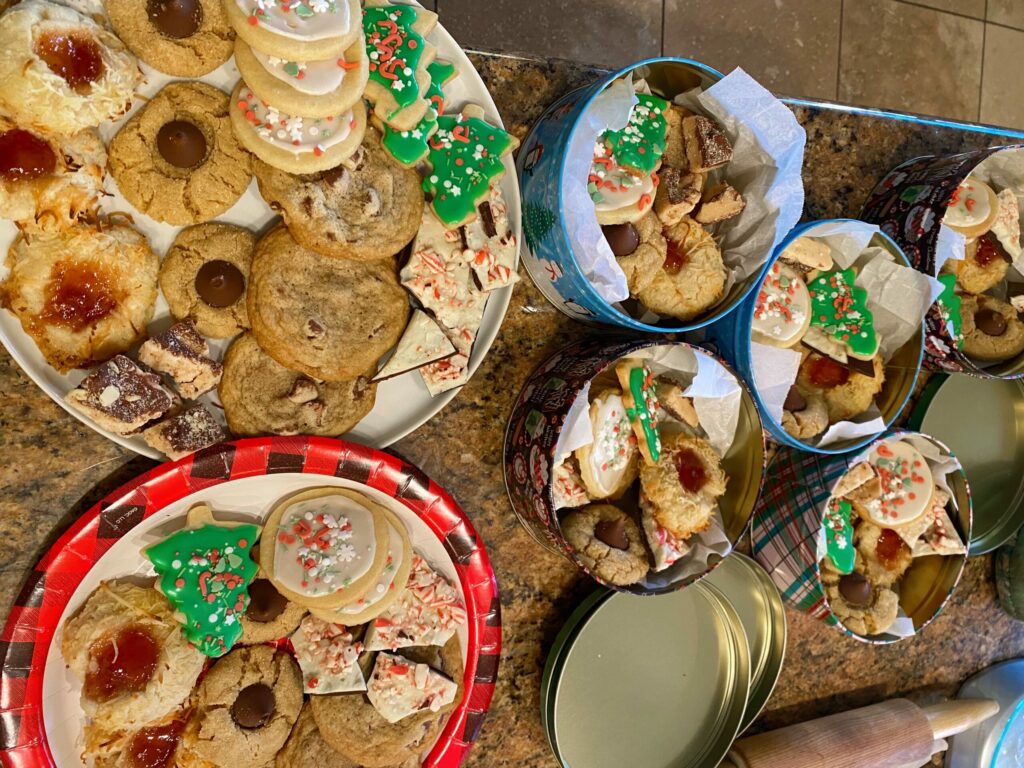
We had our annual Four Christmases wrapping party, our Christmas tree is completely dried up and dead (it’s the second year this has happened! It’s taken zero water this entire time), and I’m almost done with holiday baking. We take cookie tins to our neighbors every year.
Here’s a roundup of this year’s gift guides if you’re still shopping!
Everything is linked on my ShopMy for easy access and this page has a roundup of some of my top picks, too.
Here are this year’s gift guide top sellers:
This sequin tee (I looooove this)
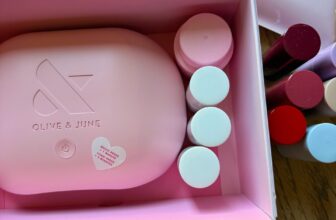
Canopy filtered showerhead (we have one in every bathroom! obsessed. My code is GINA15)
Daily Nutritional Support! I have this every single day (code FITNESSISTA10)
This belted minidress (I get compliments every time I wear it)
This maxi dress ( I bought it during their Black Friday sale)
Portable humidifier (I love this for a gift when I don’t know what to buy someone because I love it so much for travel. Use GINA15)
Gripper slippers (these are the BEST)
These cute lil Jellycat bag charms
Read, watch, listen:
Just finished this book on audio and loved all of the tiips.
Movies, books and eats from this past year.
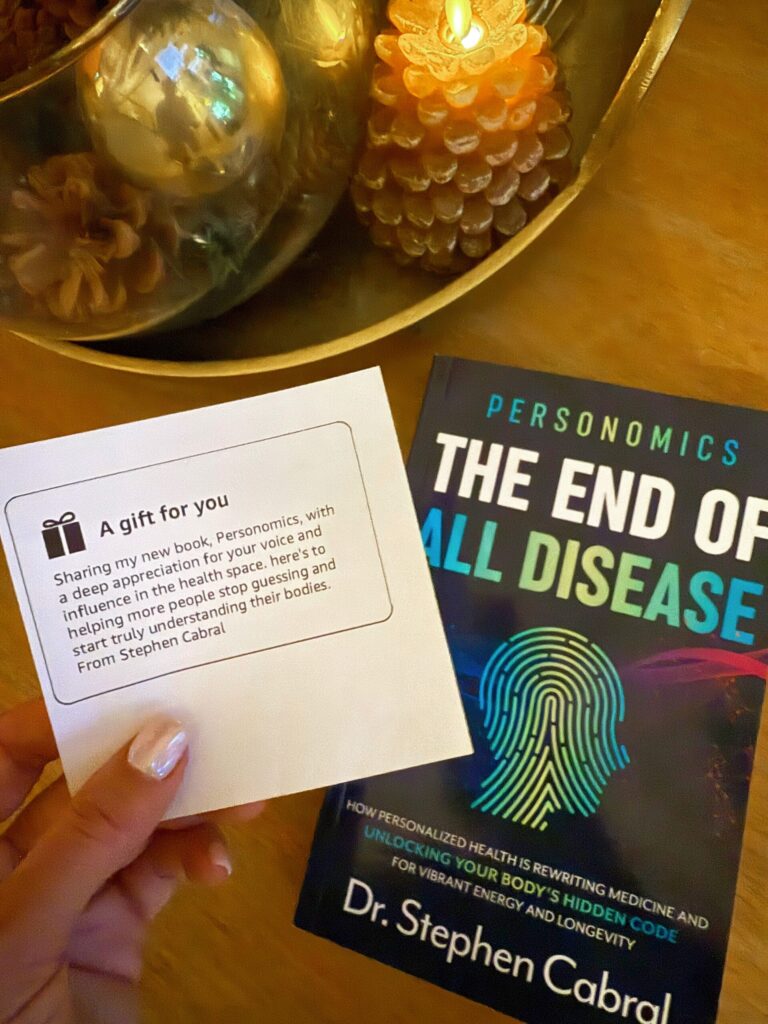
My mentor, Dr. Cabral, released his latest book, whcih he’s been working on for eight years. It’s everything I could have wished for and I had to keep myself from reading the entire thing in one sitting. I’ll do a full review soon, but I highly recommend grabbing a copy for yourself.
Took the kids to see Zootopia 2 and we all loved it!! It’s just as good as the first one.
Fitness, health, and good eats:
Our health planning class! Thank you so much to all of my internet besties who were able to attend. We had a super productive planning session mapping out your 2026 based on your health and wellness goals. If you’re already trying to plan out your health goals for the new year, stay tuned.. I have something new coming in January and can’t wait to share it with you!
This Whole Foods red lentil dahl soup copycat recipe
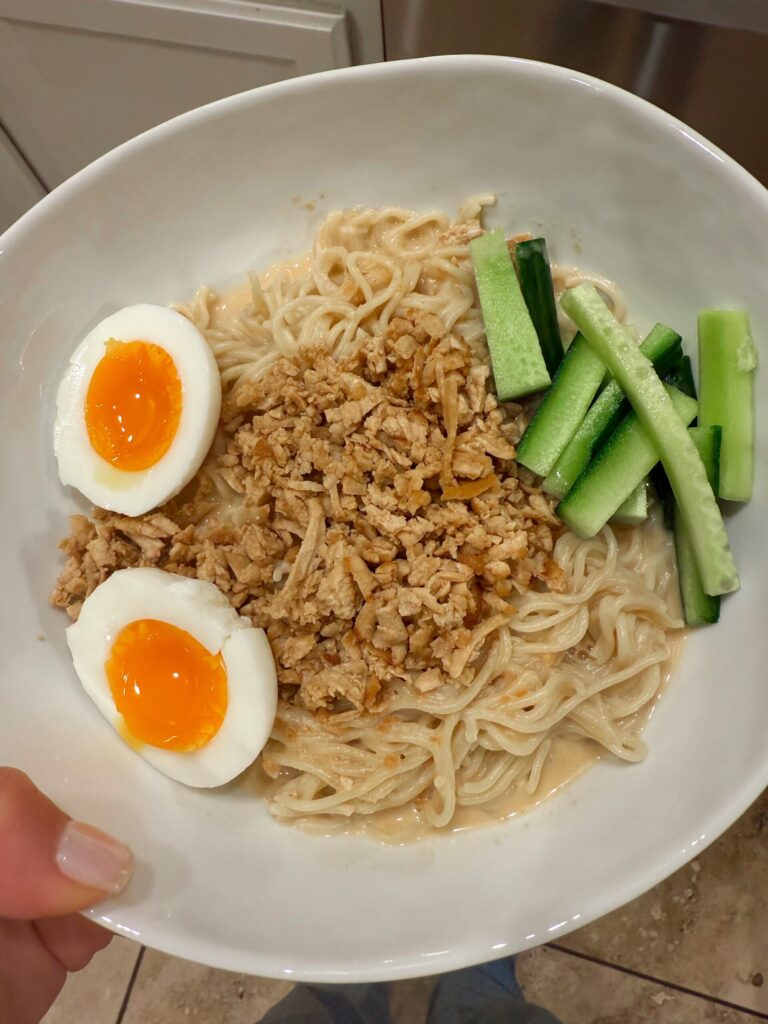
What I eat in a day <— latest on Substack
Made this for the crew and they told me it was, “bus” which means very delicious
Going to try this crustless quiche.
Blast from the past: why I tried Nutrisense and what I learned
Thank you so much for stopping by the blog today! Have an amazing weekend and I’ll see ya soon!
xoxo
Gina