There was a time when website traffic came from a handful of well-understood channels: organic search, paid ads, social media, and direct visits. But over the past few years, that picture has changed. AI-powered platforms like Google’s AI Mode, ChatGPT, Perplexity and Bing’s Copilot now act as an entirely new discovery layer. It’s one that most analytics tools weren’t built to handle.
Traffic sources have diverged, but they’re also starting to behave differently.
According to Conductor’s 2026 AEO/GEO Benchmarks Report, based on 2025 traffic data, referral traffic from AI platforms accounted for roughly 1% of website traffic across 10 major industries, with ChatGPT responsible for about 87% of AI referral traffic in the study. A separate Microsoft Clarity analysis of more than 1,200 publisher and news websites found that visitors referred by large language models converted to sign-ups at 1.66%, compared with 0.15% from search and 0.46% from social. The figures come from specific datasets, but they illustrate why even relatively small volumes of AI-referred traffic are worth measuring.
But how do you know which of your visitors actually comes from AI-driven channels if your attribution software can’t track it?
This article explains how to check website traffic and explores 10 tools to help you measure traffic across a broad range of channels.
- AI assistants like ChatGPT, Perplexity and Gemini have become a distinct source of referral traffic. Depending on the analytics setup and the referrer information available, these visits may otherwise appear under broader categories such as Referral or Direct.
- A 2025 Microsoft Clarity study of more than 1,200 publisher and news websites found that LLM-referred visitors converted to sign-ups at 1.66%, more than 10 times the 0.15% rate recorded for search in that dataset. AI referral traffic may still be small, but its quality makes it worth tracking.
- At the moment, no single tool gives you the full picture. First-party analytics platforms measure actual visits, while third-party SEO tools estimate competitor traffic. Both have trade-offs around accuracy, privacy and cost.
- Among the tools covered here, Matomo provides dedicated reporting for AI Assistant referrals and separate reports for supported AI Agent and AI Chatbot activity, helping teams distinguish human referrals from automated AI activity.
Why check website traffic?
Monitoring website traffic is important for almost any organisation with an online presence, even if most sales or services happen offline. In the internet age, customers and prospects are far more likely to research a company online before making a purchase.
SOCi’s 2025 Consumer Behavior Index found that consumers increasingly move between multiple platforms when researching brands. AI-driven discovery adds another route alongside traditional search, social media and other referral sources.
People increasingly use tools such as ChatGPT, Gemini and Perplexity to research questions and discover websites. For many sites, that creates a growing source of referral traffic worth measuring separately.
Human referrals are only one part of the picture. AI systems can also access website content directly through agents or server-side chatbot requests. Standard browser-based analytics will not necessarily capture these automated interactions, so understanding them may require dedicated detection or server-side integrations.
Organisations need a reliable view of what is happening on their sites, including where visitors come from and how they behave once they arrive.
Indeed, website data enables companies to understand their target audiences better, measure the effectiveness of marketing efforts and channels, and identify areas of the website that need improvement.
Let’s dig into those ideas in a little more detail.
Benchmark site performance
Keeping regular tabs on traffic levels is a great way to track a website’s performance over time. It can help with planning for the future and identifying current problems.
For instance, rising traffic levels may mean expanding the business’s offering or investing in more inventory. On the flip side, lower traffic levels may suggest it’s time to revamp marketing strategies or investigate SEO issues.
Analyse user behaviour
Checking website traffic, user behaviour, and other metrics shows marketing managers how users interact with the website. These traffic stats can help answer questions like:
- Which pages are users visiting?
- Which CTAs are they clicking on?
- Which page elements encourage users to take the desired actions?
It can also identify issues contributing to high bounce rates or declines in search rankings.
The better you understand user behaviour, the easier it is to give visitors what they want. For example, the data could reveal that users spend more time on landing pages than blogs. You can use these insights to optimise blog content and improve performance.
Improve the user experience
Once you understand user behaviour, it’s easier to make adjustments, update content and improve the overall user experience. This also allows companies to create more personalised customer experiences, which can lead to growth.
That could take the form of sweeping changes, such as rearranging a website’s navigation bar based on user behaviour. It could also be personalisation that uses analytics to transform sections or entire pages based on individual user behaviour.
Optimise digital marketing strategies
Knowing current traffic levels and how they trend over time helps teams set benchmarks and prioritise marketing efforts.
Monthly traffic reports can inform SEO efforts and benefit marketing attribution. For example, they could indicate when it’s time to double down on organic traffic or when the better strategy is to invest more in PPC advertising.
Increasing organic traffic levels from other countries can help businesses identify new marketing opportunities. If traffic levels from a neighbouring country or a growing market increase significantly, it could be time for a cross-border campaign.
Filter unwanted traffic
Some website traffic comes from bots and other unwanted sources. This can compromise the quality of website data and make it harder to draw useful insights. While it’s nearly impossible to get rid of this traffic completely, many analytics tools have features to filter it out of the stats.
Why check competitors’ website traffic
Websites are windows into businesses and their strategies. That’s why monitoring traffic and other metrics drawn from competitors is essential.
There’s a lot to learn from the competition, both good and bad. What competitors do well can be replicated, and learning from the elements they get wrong can help you avoid making the same mistakes.
- Strategic planning: Looking at traffic on specific pages can offer insight into potential marketing campaigns and highlight gaps in the market that may be worth attacking. Looking at their organic, paid, social and referral traffic levels can highlight opportunities for growth or pinpoint the reasons for success in a particular area.
- Benchmarking: Looking at website traffic in isolation can lack context. Monitoring other sites’ engagement metrics, such as bounce rate and average session duration, can give you an inside look at the competition and help you set realistic performance goals and benchmarks.
- Product development: Significant traffic volume on certain pages can indicate shifts in demand and market trends, which may inform the development of new products or services. For example, if a competitive dog food supplier ranks well for the term “organic dog food”, that might be something to consider when formulating new products.
- Audience demographics: Comparing competitors’ audiences can highlight opportunities and help a business narrow its target audience. This guides messaging and campaign strategies to capture specific audience segments.
- Keyword opportunities: Examining the keywords driving the most traffic to a competitor’s website can help you uncover untapped SEO potential for your website. Analysing top-performing content on competing sites can help identify content improvement strategies to pull traffic away from competitors.
- Partnerships: Referrals are an often-overlooked traffic metric. High volumes of such traffic indicate successful partnerships between competitors and third parties, which is a model worth emulating.
9 important website traffic metrics to track
Traffic metrics depend on the priorities and goals teams have. Also, metrics and their importance can fluctuate over time. That said, some evergreen metrics matter to most teams working with web analytics:
- New visitors: Users who have never visited the website before. They are a great sign that marketing efforts are working and the website is reaching more people. But it’s also important to track how they behave on the website to ensure the site caters effectively to the needs of new visitors.
- Returning visitors: Returning visits can indicate sustained interest, repeat use or an ongoing customer relationship. Whether a higher return rate is desirable depends on the purpose of the site, so interpret this metric alongside conversions and other engagement signals.
- Bounce rate: This measures how many users leave the website without taking action. Different analytics tools measure this metric differently.
- Session duration: This is the time users spend on the website, which can reveal whether they find the site engaging. And when considered alongside the next metric, it can be especially insightful.
- Pages per session: This measures the average number of pages a user visits on a website. The more pages they visit and the longer users spend on the website, the more engaging it is.
- Traffic source: Traffic can come from various sources (organic, direct, social media, referral, etc.). Knowing the highest sources of referral traffic can help analyse and prioritise marketing efforts.
- User demographics: This shows who visits a website, which devices they use, which countries they come from, etc. While most website traffic will come from the countries targeted by marketing, an influx of new users from other countries can open the door to new opportunities.
- AI referral traffic: As AI assistants have become a new discovery channel, you’ll need to start tracking how much traffic comes from platforms like ChatGPT, Gemini and Perplexity. This metric shows whether AI-generated recommendations are driving visitors and which platforms are sending them.
- AI chatbot activity: This metric is separate from human visits. Chatbot crawl traffic measures how often AI systems fetch content from a site. Metrics like chatbot requests, acquired visits (clicks from chatbot-generated links) and click-through rate help gauge how visible content is within AI-generated answers.
10 tools to check website traffic
There are many tools for checking website traffic, but they do not all measure the same thing. First-party analytics platforms collect data from your own site, while SEO and competitive-intelligence tools usually estimate traffic from external datasets. Understanding that distinction is essential when comparing their numbers.
Many first-party analytics tools use JavaScript or another tracking method on the website to collect data such as page views, visit duration and specific interactions. Depending on the product and configuration, they may also use cookies or other identifiers to recognise returning visitors.
Many tools offer advanced event-tracking functionality. This captures specific actions, like clicks or form submissions, and provides a more granular view of engagement. The data is then statistically analysed to identify trends and calculate key metrics, such as bounce and conversion rates.
Other tools use external datasets and modelling to estimate traffic, rankings or audience behaviour for sites you do not own. These estimates are useful for competitive research, but they are not equivalent to first-party analytics data.
This section explores 10 popular tools for checking website traffic and highlights their unique features and benefits.
1. Checking website traffic with Google Analytics
When teams first start looking into their website traffic, Google Analytics is often one of the first tools they consider. It’s free to use, incredibly popular and offers a wide range of traffic reports.
It breaks down historical traffic data in many different ways. It can split traffic by acquisition channel (organic, social media, direct, etc.), by country, device or demographic. It also provides real-time traffic reports that offer a snapshot of users on the site right now and over the last 30 minutes.

Google Analytics is one of the most widely used ways to check website traffic, but its reporting is affected by consent choices and implementation. With Consent Mode, GA4 can send cookieless measurements when analytics storage is denied and, where eligibility requirements are met, use behavioural modelling to estimate some activity from visitors who decline Analytics cookies. That means teams should distinguish between directly observed data, cookieless measurements and modelled data when interpreting reports.

Sampling can also affect some GA4 analysis. In standard GA4 properties, Explorations may be sampled when a query includes more than 10 million events. Google also documents circumstances in which very large filtered datasets can trigger sampling in reports. Standard reporting is therefore not universally sampled, but advanced or high-volume analysis may use a subset of available events.
Sampling can make large datasets faster to query, but it also means the result is an estimate based on a subset of events. When a report is sampled, check GA4’s data quality indicator before drawing conclusions from small differences or anomalies.
For teams that need unsampled first-party reports, Matomo offers an alternative approach. The right comparison still depends on configuration, consent requirements and the type of analysis being performed, so avoid assuming that any analytics platform captures every visitor in every jurisdiction or setup.
GA4’s default channel groups do not currently include a dedicated AI referral channel. Visits from tools such as ChatGPT, Perplexity or Copilot may therefore appear under Referral when referrer information is available, or under another channel such as Direct when it is not.
Clicks from Google’s own AI search experiences are also difficult to separate in GA4 acquisition reporting because they are part of Google Search traffic rather than a dedicated AI channel. Google Search Console has started rolling out a separate Generative AI performance report for AI Overviews and AI Mode, but that report focuses on Google Search impressions rather than on-site behaviour.
You can build custom channel groups or filters to isolate known AI referral domains in GA4, but this requires manual setup and maintenance as platforms change. Like other referrer-based attribution, it also cannot identify a human AI referral when the source does not provide usable referrer information.
2. Checking website traffic with Matomo
Matomo is a privacy-focused, open-source web analytics platform that can be configured for cookieless tracking. In France, a Matomo configuration that meets the CNIL’s conditions for audience measurement can qualify for the authority’s consent exemption. Consent requirements still depend on the jurisdiction, configuration and data collected, so cookieless tracking should not be treated as universally consent-exempt.
Matomo records first-party website analytics without report sampling and provides several ways to inspect traffic in detail. These include:
- Visits log report
- Real-time visitor map
- Visits in real-time report
Let’s look at all of them one by one.
The Visits Log provides a granular view of individual visits, rather than only aggregated traffic totals.
Matomo’s Visits Log Report provides a detailed breakdown of tracked visits.
You can access the Visits Log from Visitors > Visits Log. Depending on your configuration and available data, each visit can include information such as:
- The location of the user
- The total number of actions they took
- The length of time on site
- How they arrived at your site
- The device they used to access your site
For high-traffic sites, the Visits Log is best used for focused investigation rather than aggregate analysis. It helps teams inspect individual visit sequences and understand what happened within a specific session.
The Real-time visitor map shows the locations of site visitors over a given timeframe. If you have an international website, it’s a useful way to see the geographic distribution of tracked visits.
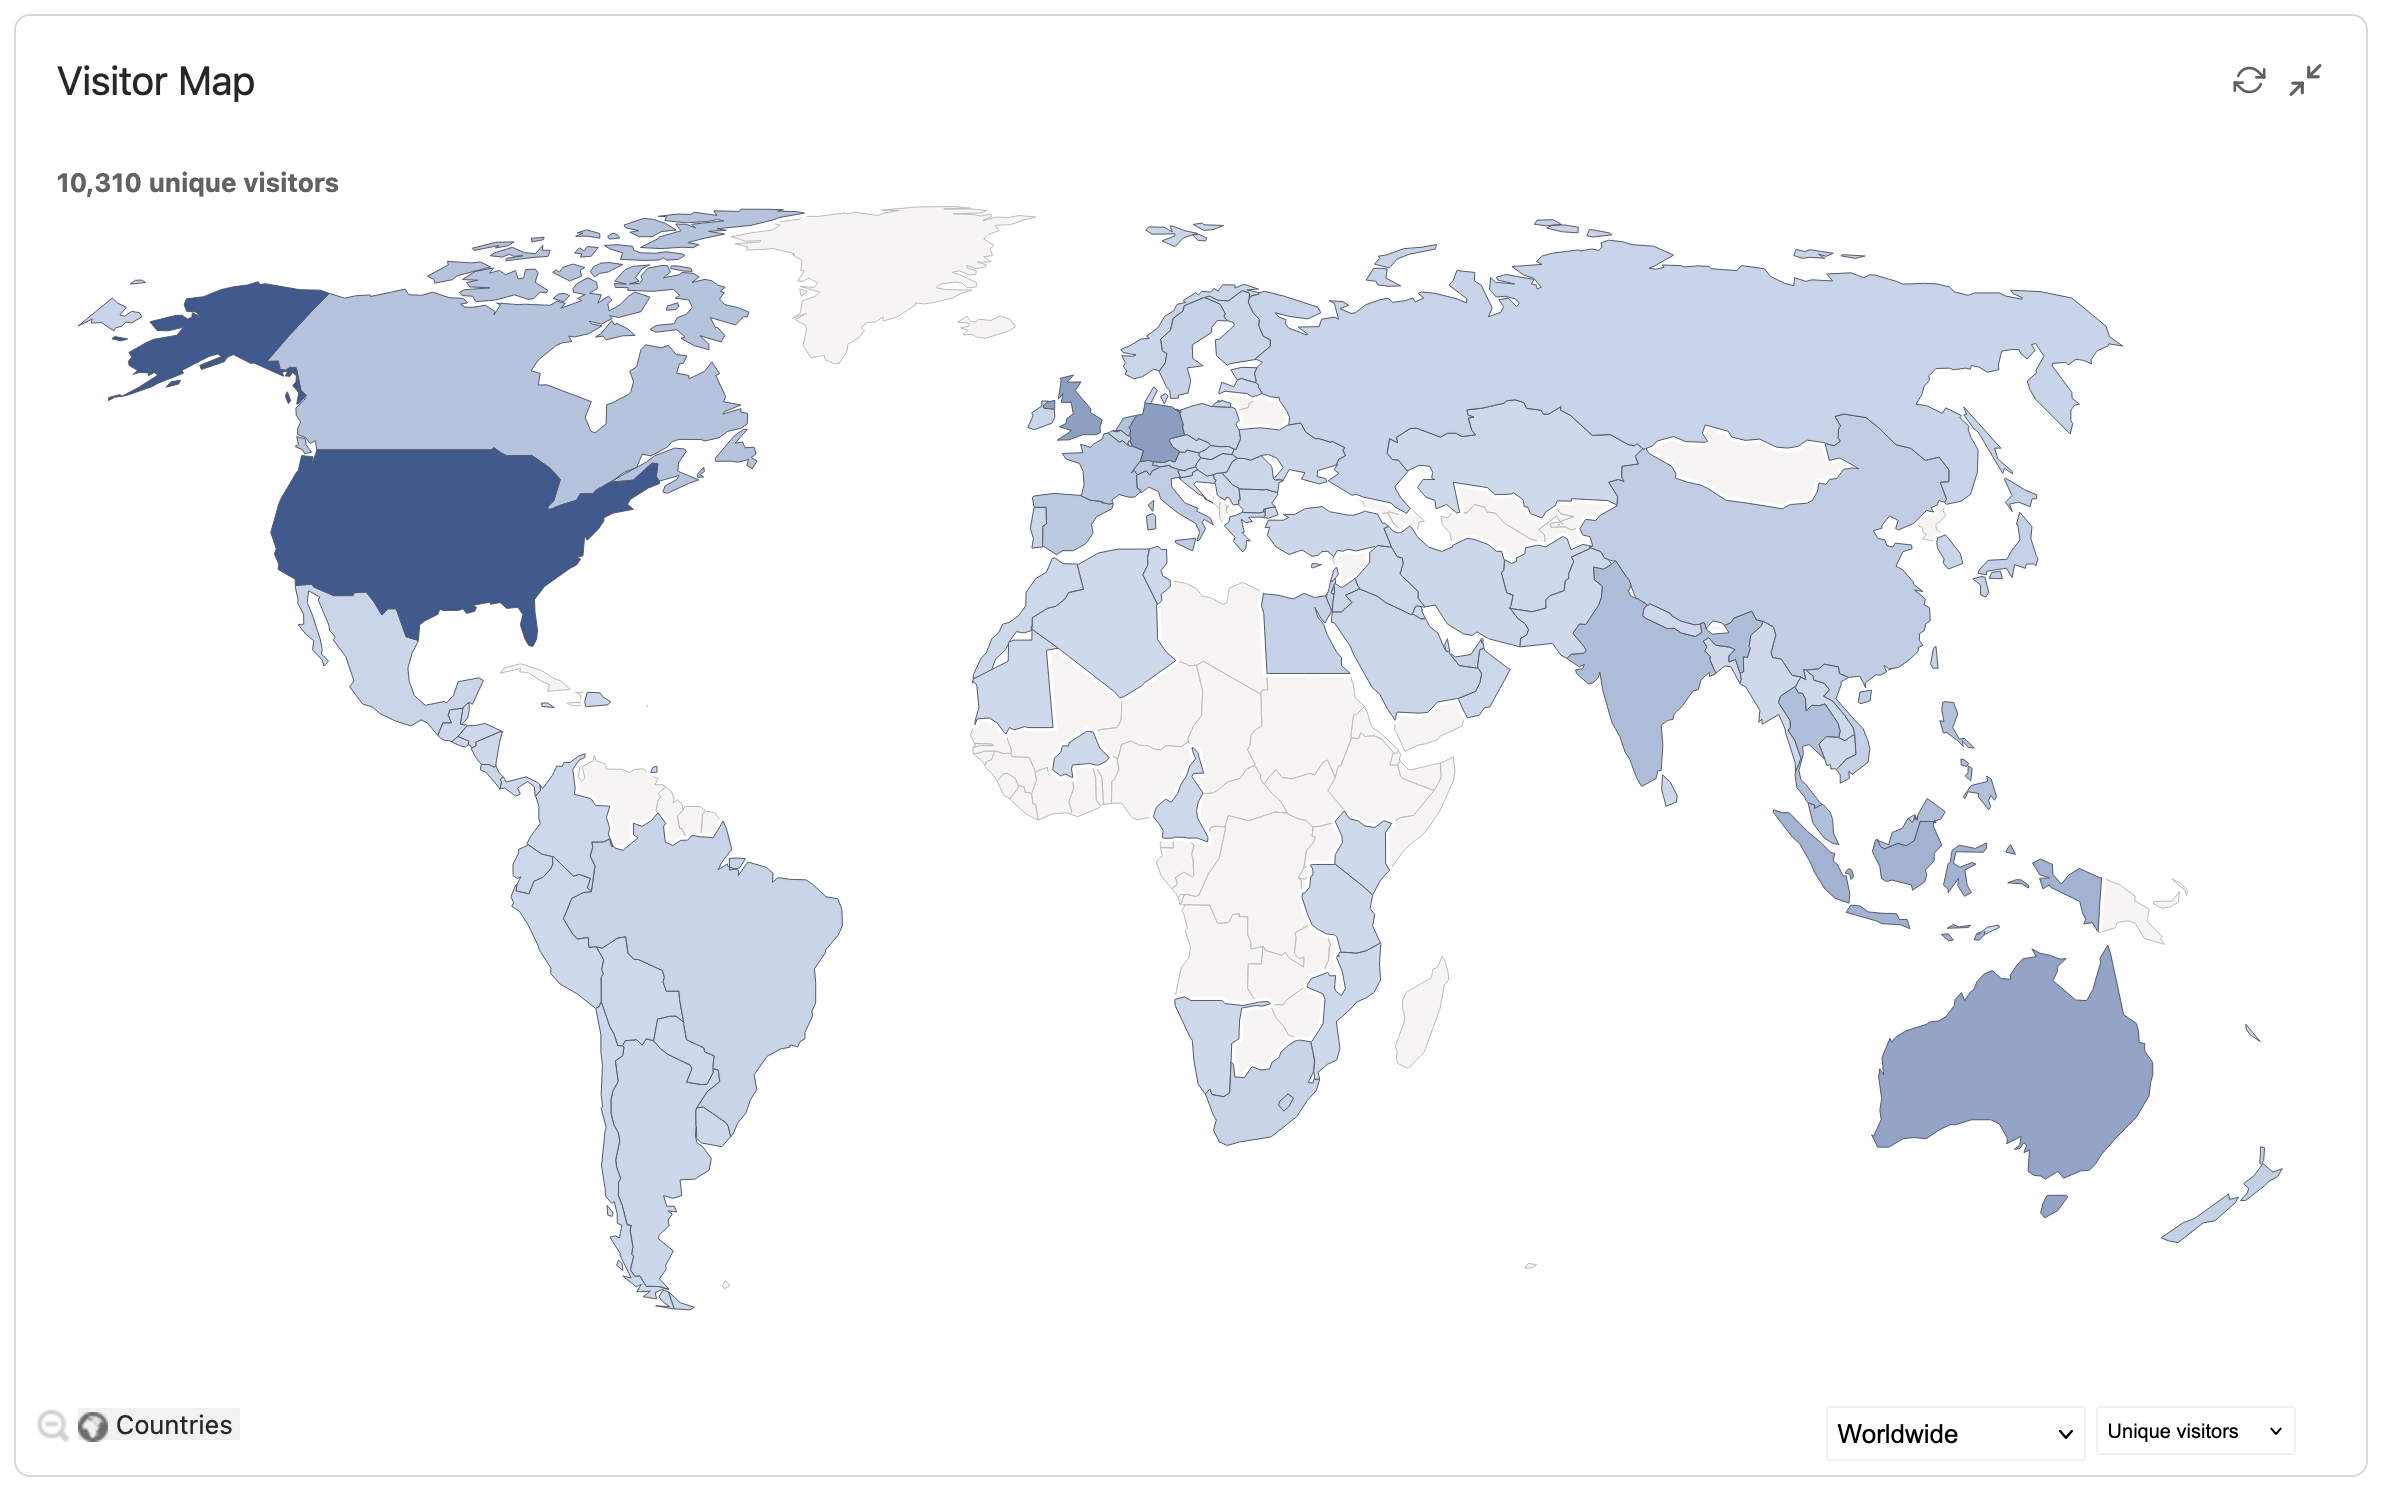
You can access the Real-time Visitor Map by clicking Visitor in the main navigation menu and then Real-time Map. The map itself is colour-coded. Larger orange bubbles represent recent visits, and smaller dark orange and grey bubbles represent older visits. The map will refresh every five seconds, and new users appear with a flashing effect.
If you run time-sensitive campaigns such as TV or radio advertising, the Real-time Map can help you see whether traffic changes immediately afterwards. Use campaign tracking and conversion data alongside the map before attributing a traffic increase to a specific advert.
Finally, the Visits in Real-time report provides a snapshot of who is browsing your website. You can access this report under Visitors > Real-time and add it to your custom dashboards as a widget.
Open the report, and you’ll see the real-time flow of your site’s users and counters for visits and pageviews over the last 30 minutes and 24 hours. The report refreshes every 5 seconds, adding new users to the top with a fade-in effect.

The report provides a snapshot of each visitor, including:
- Whether they are new or returning
- Their country
- Their browser
- Their operating system
- The number of actions they took
- The time they spent on the site
- The channel they came in from
- Whether the visitor converted a goal
AI traffic tracking
One area where Matomo differs from the other tools covered here is its built-in AI traffic reporting. The AI Assistants acquisition channel is available in Matomo Cloud and from Matomo 5.5.0 On-Premise. The AI Agent reports are available from Matomo 5.6.0, while dedicated AI Chatbot reports were introduced in Matomo 5.8.0.
Matomo includes a dedicated AI Assistants channel type that classifies visits referred by recognised AI assistant domains when referrer information is available. Supported sources include:
- ChatGPT
- Bing Copilot
- Gemini
- Claude
- Perplexity
- Meta AI and others
You do not need to build a manual regex setup or maintain a custom channel group for recognised AI Assistant referrals. They appear alongside organic, social, referral and direct traffic in Matomo’s standard Acquisition reports. As with any referrer-based attribution, however, Matomo can only attribute an AI Assistant referral when usable referrer information is available.
Beyond human referral traffic, Matomo distinguishes two different types of automated AI activity:
- The AI Chatbots Overview report covers server-side requests from supported AI chatbots that retrieve website content without executing the standard JavaScript tracker. Chatbot tracking requires a supported server-side integration, such as WordPress, Cloudflare, Amazon CloudFront or the HTTP Tracking API. Reports include metrics such as chatbot requests, acquired visits and click-through rate.
- The AI Agent Overview report covers recognised autonomous AI systems that can interact with websites without continuous user input. Matomo can identify supported agents when they execute the Matomo tracker or send suitable tracking requests and identifying signals. The report compares AI Agent activity with human visits side by side.
You can also create a custom segment using the condition “Channel Type is AI” to analyse AI Assistant referral visits across other Matomo reports, including behaviour and conversion data.
3. Checking website traffic with Google Search Console
Google Search Console is a free tool that analyses a website’s Google search traffic. The top-line report shows how many times the website has appeared in Google Search, how many clicks it has received, the average click-through rate and its average position in the search results.

It’s a great way to understand what the website ranks for and how much traffic organic rankings generate. It will also show which pages are indexed in Google and whether there are any crawling errors.
Unfortunately, Google Search Console is limited if a complete view of traffic is needed. While search traffic can be analysed in great detail, it will not report how users who access the website behave on the site.
Google Search Console still does not provide referral analytics for traffic arriving from external AI assistants such as ChatGPT or Perplexity because it measures performance within Google Search. However, Google has started rolling out a separate Generative AI performance report for eligible properties, showing impressions from AI Overviews and AI Mode.
The Generative AI performance report can show which pages receive impressions in Google’s generative AI features, as well as dimensions such as country, device and date. It does not replace first-party analytics: to understand what visitors do after clicking through, you still need an on-site analytics platform.
Access to Google’s Generative AI performance report is still rolling out, so not every Search Console property will see it yet.
4. Checking website traffic with Similarweb
Similarweb is a website analysis tool that estimates the total traffic of any site on the internet. It is one of the best traffic checker tools for estimating how much web traffic competitors receive.
What’s great about Similarweb is that it estimates total traffic, not just search engine traffic, unlike many SEO tools. It even breaks traffic down by channel for easy comparison.

Similarweb provides estimates of total visits, bounce rate, average number of pages viewed per visit, and average duration on the site. The company also has a free browser extension that continues checking website traffic estimates while the user is browsing the web.
Similarweb can also estimate AI-driven referral traffic at the domain level. That makes it one of the few competitive intelligence tools that shows you roughly how much traffic AI platforms send to any website. It’s useful for benchmarking against competitors, though you have to note that the figures remain estimates rather than precise counts.
Similarweb offers limited free access. Its Competitive Intelligence plan currently starts at $125 per month when billed annually, with separate products available for AI Search Intelligence. Pricing and packaging change, so check the current plan before buying.
The price isn’t the only downside for Similarweb. Ultimately, it provides reasonably accurate estimates but falls short of a comprehensive traffic analytics tool.
5. Checking website traffic with Semrush
Semrush is a collection of marketing solutions for online businesses. Its Traffic Analytics tool analyses up to 100 websites and compares their traffic side by side. For each site, it reveals the top pages, the regions from which most of the traffic comes, and the locations from which the most referrals come.
Semrush also gathers insights into competitors’ audiences and their activity, especially activity that overlaps between the sites being checked. It extracts and analyses comprehensive data on organic and paid search, social media, and backlinks.
Semrush has also moved into AI traffic tracking with its AI Visibility Toolkit, which was launched in 2025. At the moment, the toolkit monitors how a brand appears in AI-generated results across ChatGPT, Google AI Overviews, AI Mode, Perplexity and Gemini.
It’s available as a dedicated add-on starting at $99 per month per domain, or bundled into Semrush One plans. One thing you should keep in mind is that this doesn’t track AI referral traffic to your site the way a web analytics platform does. Instead, it tells you how often AI platforms cite or recommend your brand. That’s a different question altogether, but a valuable one for teams thinking about AI-driven discoverability.

Semrush’s SEO Classic toolkit currently starts at $139.95 per month, while its AI Visibility toolkit starts at $99 per month per domain. The overall cost can rise quickly when teams need multiple toolkits, domains or users, so compare the package against the specific data you need.
6. Checking website traffic with Ahrefs
Ahrefs‘s biggest strength is its organic traffic estimation capabilities. It estimates monthly visits from Google worldwide, the Google keywords in the top 100 that a website ranks for, and traffic value via an equivalent to PPC.

Ahrefs bases its estimates on ranking data from a database of roughly 28.7 billion keyword topics across global markets, which is why it is so powerful. It generates a detailed report that includes organic traffic estimates, backlink data, and top-performing keywords.
However, the numbers produced by Ahrefs are estimates based on available data and may not be 100% accurate. This is particularly true for smaller or newer websites that lack the data volumes needed for accuracy.
Ahrefs has also introduced Brand Radar, an AI visibility add-on that tracks how a brand is mentioned and represented across AI-generated responses. It’s priced at $199 per month per AI index (or approximately $699 per month for all six indexes), and it sits on top of a core Ahrefs subscription.
But as of May 2026, the company has introduced “prompt-only” packages where you can pay for a specific set of prompts and cross-check them against every available AI index. The packages for those start at $50 for 2,500 prompts per month.
Like Semrush’s toolkit, Brand Radar focuses on visibility within AI outputs rather than tracking inbound AI referral traffic directly.
Ahrefs offers limited free tools, while its paid plans add broader research and reporting capabilities. Current paid options include Starter at $29 per month and Lite at $129 per month, with higher-tier plans available for larger teams.
7. Checking website traffic with Serpstat
Serpstat is an SEO solution that grew from a simple keyword research tool. It offers more comprehensive features to help businesses understand their website’s performance. It helps improve a site’s visibility through tools for rank tracking, keyword research, traffic checking, backlink analysis, and site auditing.

It provides metrics like estimated monthly visits, traffic sources (organic, paid, and referral), and insights into top-performing pages. Serpstat also offers competitor analysis features that help to identify market trends and refine growth strategies. However, like Ahrefs, the numbers provided are estimates, which are only as good as the depth of data from which they are derived.
Serpstat’s current plans start with Individual at $50 per month, while Team starts at $100 per month and Agency at $410 per month on its published pricing page. The Team tier adds features including:
- ChatGPT and Claude Integration (MCP)
- AI Overview Brand Opportunities Report
- Share Access
- AI Tools
The platform doesn’t offer this in the lower-priced plans, so you have to spend more to access these features.
8. Checking website traffic with SEO PowerSuite
SEO PowerSuite also goes some distance beyond just website traffic checking. As the name implies, it’s a suite of tools to improve website rankings.

There are four tools in the suite:
- Rank Tracker enables tracking a website’s search engine rankings across multiple keywords and search engines.
- Website Auditor offers SEO analysis of website pages and recommends actions to boost performance.
- SEO SpyGlass analyses a website’s backlink profile to highlight link-building possibilities that’d help improve performance.
- LinkAssistant helps identify suitable websites for link building and recommends viable outreach opportunities.
SEO PowerSuite offers a free edition alongside paid licences. Check its current pricing and AI-search coverage before choosing a plan, as both product capabilities and packaging can change.
9. Checking website traffic with Ubersuggest
Ubersuggest is also an SEO-focused tool. It offers website traffic analysis, keyword rankings, backlink profiles, and competitor insights. These are packaged in reports that provide an overview of website traffic, including monthly organic traffic totals and the number of organic keywords the site ranks for. Ubersuggest also offers content suggestions.

Like other tools in this category, Ubersuggest doesn’t collect comprehensive data, so its numbers are estimates. This means the accuracy can vary. However, it remains a solid choice for providing great insights and enhancing a website’s online presence.
Ubersuggest also includes AI Search Visibility features for monitoring how a brand appears in AI-driven search experiences. This is visibility monitoring rather than first-party measurement of visits to your website.
This tool offers limited free access and paid plans with different project and usage limits. Because its pricing and AI-search allowances change over time, check the current plan details before subscribing.
10. Checking website traffic with MonsterInsights
MonsterInsights is a tool worth considering for WordPress websites because it’s not a typical website-checking tool. It’s a WordPress plugin that simplifies the task by integrating Google Analytics directly into a website.
MonsterInsights then uses raw GA4 data to extract actionable insights into audience preferences and activity. This makes it easier to focus on the relevant metrics for different types of websites. For example, the metrics used to measure a blog site would differ from those for an ecommerce site.
But there are some downsides, too. While the basic version is free, advanced reports and integrations require a paid plan. Current promotional pricing starts at $99.50 per year for Plus and $199.50 for Pro, while the 25-site Elite Bundle is listed at $299.50 per year. Check the current pricing page before buying, as promotional rates can change.

Why do my traffic reports differ?
If you use more than one of the methods above to check your website traffic, you’ll quickly realise that every traffic report differs. In some cases, the reasons are obvious. Any tool that estimates your traffic without adding code to your website is just that: an estimate. Tools like many of those mentioned here will never offer the accuracy of analytics platforms like Matomo and Google Analytics.
Each platform records and processes activity differently. Consent settings, tracking methods, attribution rules, bot filtering, time zones, identity resolution and sampling or modelling can all change the numbers you see.
Consent is one source of discrepancy. With GA4 Consent Mode, denied analytics storage can still result in cookieless measurements, and eligible properties can use behavioural modelling to estimate some activity from visitors who do not consent to Analytics cookies. Those modelled or cookieless measurements are not the same as fully observed, cookie-based visitor data.
Matomo can be configured to track without cookies, which can support privacy-conscious measurement and, in some jurisdictions and configurations, consent-exempt audience measurement. But consent requirements vary by country and setup. For example, Matomo’s own guidance notes stricter ePrivacy requirements in jurisdictions such as Germany and the UK, while France’s CNIL exemption applies only when specific conditions are met. Differences between Matomo and GA4 should therefore be interpreted in the context of each implementation rather than as a universal traffic uplift.
Consent choices can materially affect the amount and type of directly observed analytics data available, especially where a setup depends on non-essential cookies or identifiers.
A 2024 analysis of more than 1.2 million cookie-banner interactions found that 25.4% of visitors clicked ‘Accept all’, while many others rejected, closed or ignored the banner. The precise impact on analytics depends on the consent implementation and measurement method, but the study illustrates why consent behaviour can materially affect observed data.
AI traffic attribution adds another layer of discrepancy. Different analytics platforms classify AI referrals differently. In GA4, visits from recognised external AI tools can appear under broader channels such as Referral, while visits without usable referrer information may appear elsewhere. Google’s AI Overviews and AI Mode are part of Google Search rather than a dedicated AI acquisition channel in GA4.
Matomo gives recognised AI Assistant referrals their own acquisition channel when referrer information is available. The same visit may therefore be categorised differently across analytics products, which is one reason cross-platform traffic totals and channel reports rarely match exactly.
If you rely on web analytics for important decisions, understand how your chosen platform collects, models and categorises data, and validate material discrepancies before acting on them.
What to do if website traffic levels drop
Experiencing a drop in website traffic can be frustrating, but it happens to everyone at some point. Here’s how to address it:
- Analyse traffic sources: Use analytics tools to pinpoint the source of the decline, like organic search, referrals, or social media.
- Check for technical issues: Look for broken links or slow loading times, which can deter visitors. Tools like Google Search Console can help identify errors.
- Review recent changes: Consider any recent updates to the website. If something coincided with the drop, it might be worth reverting.
- Evaluate content quality: Ensure the content is engaging and relevant. Update or improve underperforming posts.
- Check AI-driven discovery patterns: AI platforms can surface your content without always generating a click. Review AI Assistant referrals, AI visibility data and, where available, Google Search Console’s Generative AI performance report to understand whether discovery is shifting towards AI-generated results.
- Reassess the marketing strategy: Revisit the balance between paid ads, social media and other channels to evaluate their effectiveness and adjust the approach.
Website traffic naturally fluctuates, but sustained declines deserve investigation. Use the available data to identify which source, page group or audience changed before deciding how to respond.
Get more accurate traffic reports with Matomo
There are several ways to check website traffic. Competitive-intelligence tools estimate traffic to sites you do not own, while first-party analytics platforms measure activity on your own site. Matomo provides unsampled first-party reporting, flexible privacy controls and dedicated AI reporting that distinguishes AI Assistant referrals from supported AI Agent and AI Chatbot activity.
Join organisations around the world using Matomo to understand website traffic while retaining control over their analytics data. Start your 21-day free trial — no credit card required.
FAQs
How do I know who visited my website?
Many web analytics tools use JavaScript or another tracking method to record visits and interactions. Depending on the setup and data available, this can include device and browser information, approximate location, referral source and actions taken. Matomo’s Visits Log lets you inspect individual visits in detail, including how a visitor arrived and which tracked actions occurred during the visit.
Which traffic checker is most reliable?
For a site you own, first-party analytics platforms such as Matomo and Google Analytics are generally more suitable than competitor-estimation tools because they measure activity on the site directly. Matomo provides unsampled reports and can be configured for cookieless tracking, but the completeness of any analytics dataset still depends on consent requirements, implementation, blockers and other technical factors.
How do I check my website traffic for free?
For your own website, Google Analytics offers free first-party analytics, while tools such as Ahrefs provide limited free SEO and traffic-estimation features. Matomo Cloud offers a 21-day free trial, and Matomo On-Premise is available as open-source software for teams that want to host it themselves.
Is it legal to check website traffic?
It is generally legal to measure traffic on a website you operate, but how you collect and process visitor data must comply with the laws that apply to your organisation and audience. In the EU, this can include the GDPR and national ePrivacy rules; in the UK, the UK GDPR and PECR are relevant. Consent requirements depend on the technologies, purposes and data involved, so do not assume that every analytics configuration has the same legal basis.
Can competitors see my website traffic?
Your competitors can’t see your exact traffic data unless they have direct access to your analytics account. However, third-party tools like Similarweb, Semrush and Ahrefs can estimate traffic volumes, top-performing pages, referral sources and keyword rankings for any publicly accessible website. They offer directionally accurate data, although the estimates can be off.