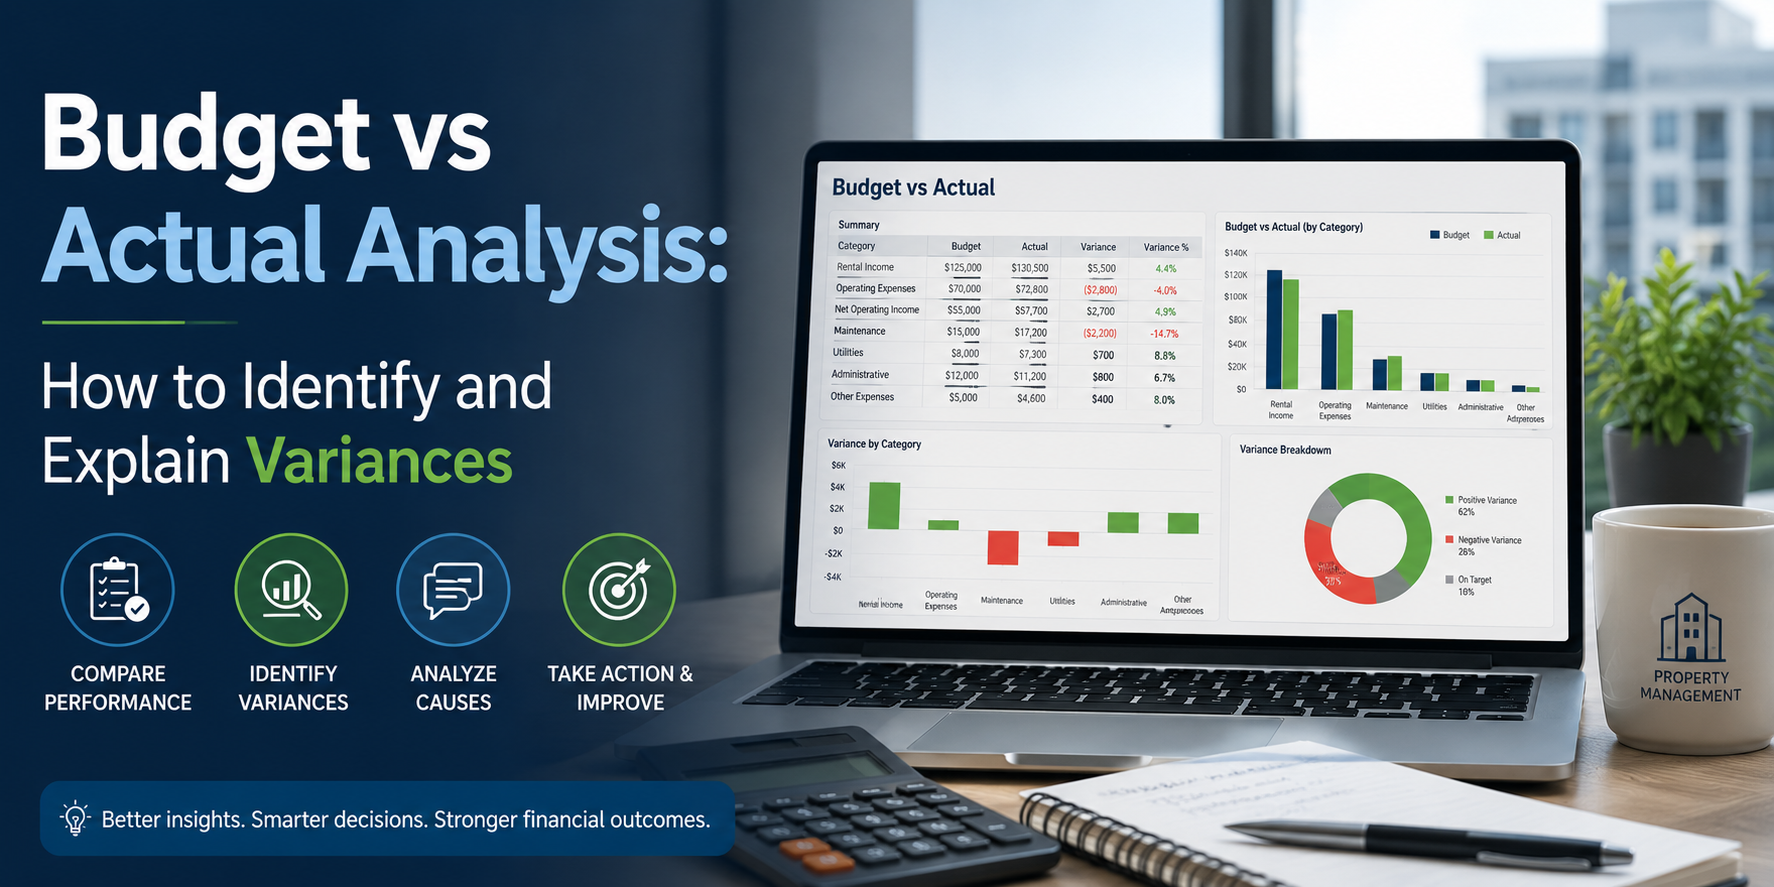
Budget vs actual analysis compares what you planned to spend or earn against what actually happened. It tells you where your assumptions held up and where they did not. The result is called a variance. Favorable variances mean reality beat the plan. Unfavorable variances mean it did not. The budget variance formula is: Actual Amount minus Budgeted Amount equals Variance. What makes this process valuable is not the math. It is what you do with the answer.
According to Gartner research cited by Workday, only 13% of organizations detect performance issues before they impact financial results. The remaining 81% remediate too slowly to influence outcomes. That statistic captures exactly why variance analysis in budgeting needs to happen during the period, not after it closes.
Key Takeaways
- Budget variance = Actual minus Budgeted. Express it in dollars and as a percentage.
- Variances are favorable or unfavorable. Both need explanation.
- Root causes fall into two buckets: internal and external.
- Timing differences cause many variances. These reverse later and may not need action.
- Variance analysis is only useful if it triggers a decision.
- Faster, automated reporting gives teams more time to analyze rather than compile.
How Do You Calculate Budget Variance?
The budget variance formula is:
Variance = Actual Amount − Budgeted Amount
For a percentage, use the budget variance analysis formula:
Variance % = (Actual − Budgeted) ÷ Budgeted × 100
Two quick examples:
| Line Item | Budget | Actual | Variance ($) | Variance (%) | Type |
| Revenue | $500,000 | $540,000 | +$40,000 | +8% | Favorable |
| Operating Costs | $200,000 | $230,000 | +$30,000 | +15% | Unfavorable |
For revenue lines, actual above budget is favorable. For expense lines, actual above budget is unfavorable. Apply the same budget variance formula consistently across every line item.
Most finance teams apply a materiality threshold before investigating. A common benchmark is 5% to 10% per line item, or a defined dollar floor. Variances below that get noted. Variances above it get explained.
What Types of Budget Variances Should You Track?
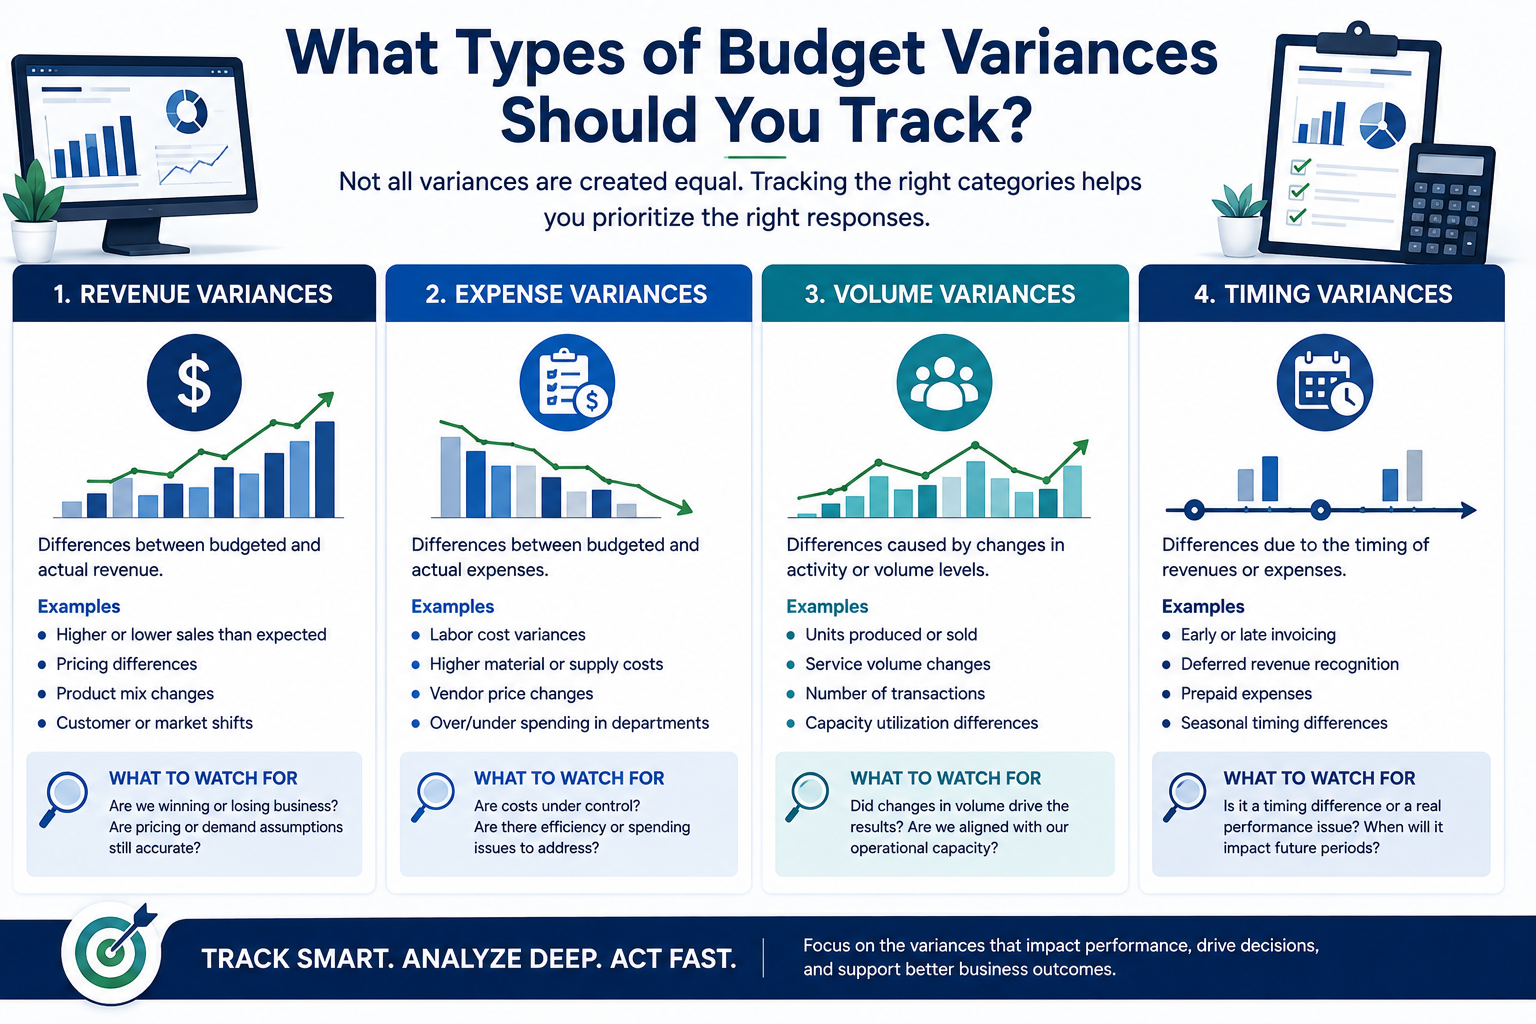
Not all variances are created equal. Tracking the right categories helps you prioritize the right responses.
Revenue variances: These appear when actual sales or income differ from the budget and actuals projection. Common causes include pricing changes, volume shifts, and timing of contract recognition under FASB ASC 606.
Expense variances: These occur when actual costs exceed or fall below the budget. Overspending signals either poor forecasting or unexpected cost drivers. Underspending can signal efficiency or deferred investment.
Volume variances: These reflect changes in activity level. Higher demand drives more variable costs. Lower demand reduces them.
Timing variances: These are temporary. Revenue or an expense lands in a different period than planned. The variance reverses in the following period. Flag them clearly so they are not misread as structural problems.
How Do You Identify the Root Cause of a Budget Variance?
Identifying root causes requires separating internal factors from external ones. The fix for each is different. APQC’s financial management benchmarks track how top-performing finance teams structure this process monthly.
Internal causes:
- Inaccurate forecasting at budget time
- Delayed hiring or deferred projects
- Unexpected staff turnover
- Operational process changes mid-period
External causes:
- Supplier price increases
- Interest rate or commodity shifts
- Demand changes outside your control
- Regulatory cost changes
Ask two questions for every material variance. Was this caused by something we controlled or something we did not? Is this a one-time event or a recurring pattern? The answers determine your response.
How Do You Explain Budget Variances Clearly?
Explaining budget variances is where most finance teams lose time. Pulling actuals is fast. Writing explanations that hold up in a leadership review takes longer.
A clear variance explanation has three parts:
- What happened. State the variance in dollar and percentage terms.
- Why it happened. Name the specific cause. Not “market conditions.” Something specific.
- What happens next. State whether the variance is isolated or ongoing, and whether the forecast needs updating.
Avoid vague commentary. “Higher than expected costs” explains nothing. “Legal fees exceeded budget by $18,000 due to an unplanned contract dispute resolved in March” explains everything.
What Is a Good Cadence for Budget vs Actual Reviews?
Most businesses review budget and actuals monthly. Some review weekly for high-velocity expense categories. Quarterly is too infrequent to catch problems early.
A structured monthly process looks like this:
- Days 1-3: Close the books and pull actuals from the ERP
- Days 3-5: Calculate variances and flag anything above your materiality threshold
- Days 5-7: Investigate flagged variances with department owners
- Days 7-10: Compile commentary and finalize the reporting package
This timeline only works if the underlying data is clean. Under IRS Publication 334, accrual-basis businesses must recognize income and expenses in the period in which they are earned or incurred. Variance analysis based on cash-basis data will not accurately reflect it.
What Happens When Reporting Is Too Slow to Support Variance Analysis?
Variance analysis depends on timely data. When monthly reporting takes 6 to 10 hours per property, the analysis arrives too late to influence decisions still in motion.
A New York-based real estate property management company managing multifamily, affordable housing, and mixed-use assets faced exactly this problem. Their monthly investor and stakeholder reporting packages were extracted manually from Yardi Voyager. Each property required 6 to 10 hours per month.
According to APQC’s 2025 benchmarking study, the median monthly close takes 6.4 days across 2,300 organizations. Manual reporting compounds that delay. Reports included budget-versus-actual comparisons, the trial balance, the balance sheet, the general ledger, the rent roll, and compliance outputs. Deadlines were frequently strained. Key-person dependency meant any absence created risk.
OHI deployed an RPA specialist to map the full reporting workflow, then built an automated bot using Python, Selenium, Pandas, OpenPyXL, and Streamlit to extract, consolidate, format, and validate the complete reporting package from Yardi. The bot ran against authorized credentials and embedded validation checks to confirm completeness. OHI trained the client’s team to operate the automation independently and delivered full documentation covering execution, exception handling, and troubleshooting.
The result:
- Reporting time dropped from 6-10 hours to under 1 hour per property
- Delivery timelines improved by 2 to 3 days
- Output was 100% standardized and error-free
- The workflow scaled without adding headcount
As their Finance Director put it: “What previously required hours of manual effort is now completed in minutes, with complete accuracy and consistency.”
Read the full reporting automation case study here
How Does Budget Variance Analysis Connect to Broader Financial Reporting?
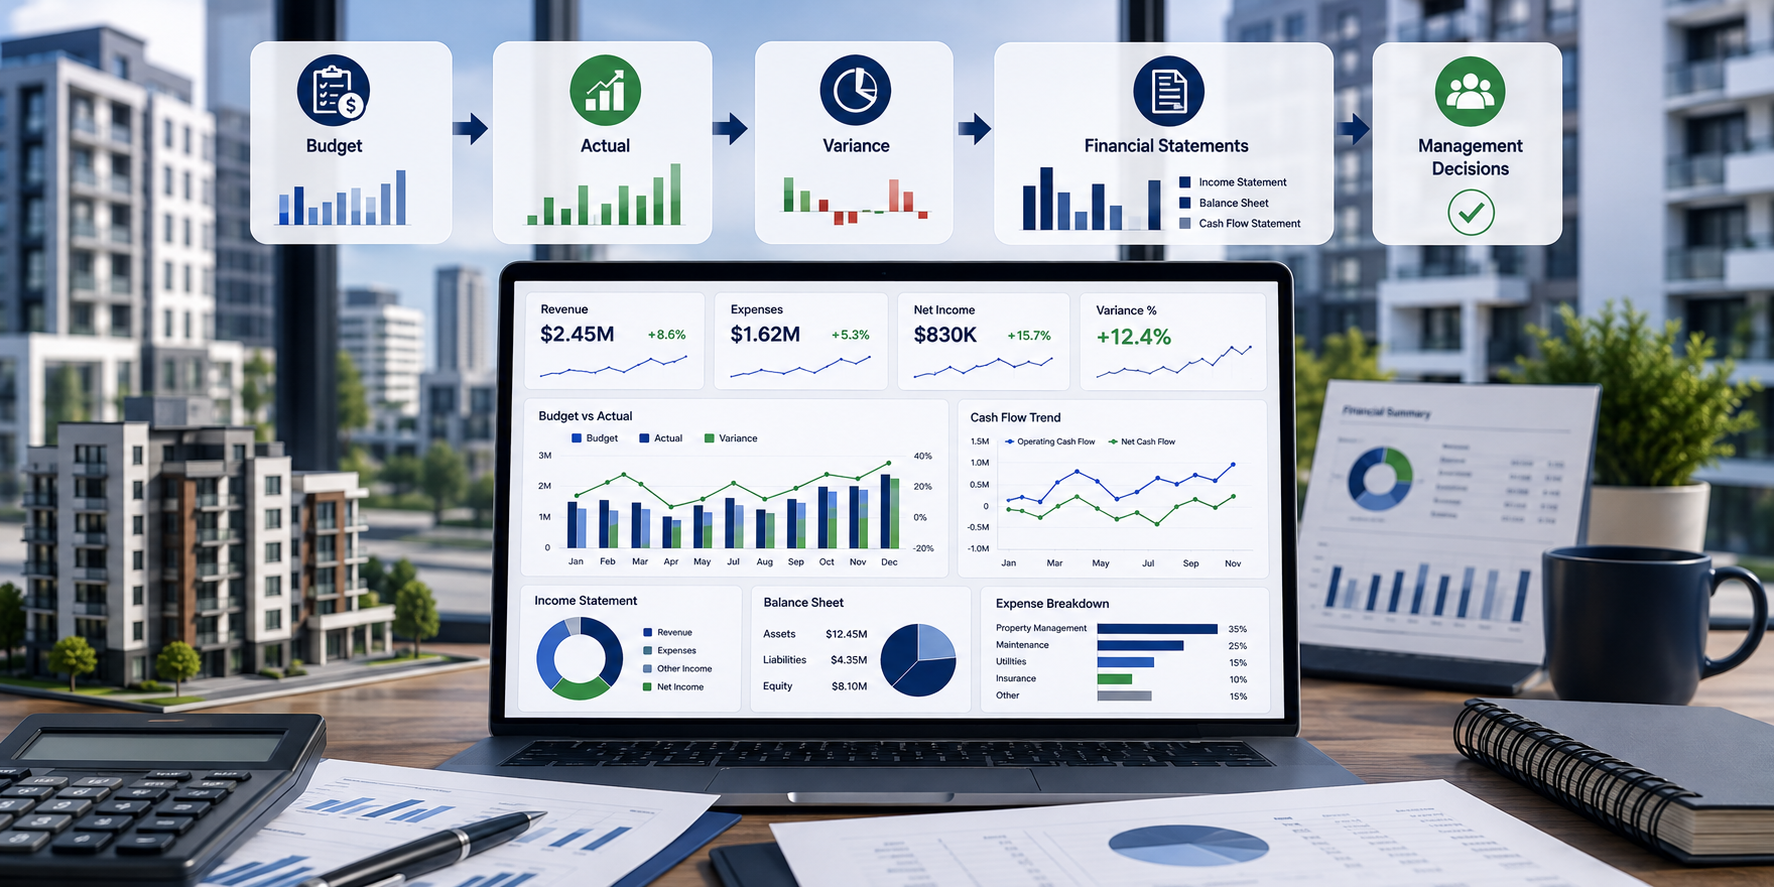
Budget variance analysis connects to every layer of your financial reporting process.
Your general ledger and reconciliation processes are the source of your actuals. If those are wrong, your variance analysis is wrong. Your accounts payable function affects the timing of expenses. Late invoice processing creates timing variances that are not real. Your accounts receivable function affects the timing of revenue recognition. Delayed AR creates unfavorable revenue variances that reverse once invoices post.
For real estate portfolios, property-level accounting feeds directly into budget-versus-actual reporting for each asset. NOI variances roll up into fund-level performance against plan. Real estate fund accounting teams use variance analysis to explain performance to investors. CPA firms need the same discipline applied consistently across all client engagements.
When the underlying books are clean, variance analysis becomes a management tool. When they are not, it becomes a reconciliation exercise.
OHI and Budget vs Actual Reporting
OHI supports businesses across the US, the UK, Canada, and Australia with the full accounting infrastructure that enables meaningful variance analysis. The teams that benefit most from automated variance analysis are those whose underlying books are already clean and structured.
From real estate accounting and bookkeeping support to investor reporting packages and automated financial outputs, OHI’s teams work in QuickBooks, Xero, Yardi, NetSuite, MRI, and AppFolio.
If your budget vs. actual reporting is arriving late, contains errors, or consumes too much team time, speak to OHI’s accounting team about building a more reliable reporting process.
Frequently Asked Questions
What is the budget variance formula?
Variance = Actual Amount minus Budgeted Amount. For a percentage, divide by the Budgeted Amount and multiply by 100. Apply this to every material line item in your budget and actuals review.
What is the difference between a favorable and an unfavorable variance?
A favorable variance means actual results beat the plan. For revenue, that means exceeding the budget. For expenses, it means spending less. An unfavorable variance is the reverse. Both require explanation. A favorable expense variance can signal deferred investment rather than genuine savings.
How often should budget vs actual analysis be done?
Monthly is standard. Some teams review high-velocity cost lines weekly. Quarterly is too infrequent. Catching a variance six months after it started leaves little time to respond.
What causes large budget variances?
Common causes include inaccurate original assumptions, unexpected market changes, volume shifts, timing differences, and one-time events. Separating internal from external causes determines the right response.
How do you calculate budget variance as a percentage?
Divide the dollar variance by the budgeted amount, then multiply by 100. If actual revenue was $540,000 against a budget of $500,000, the variance is $40,000 or 8% favorable. Use both figures together. A $500 variance at 50% is often more significant than a $50,000 variance at 1%.