

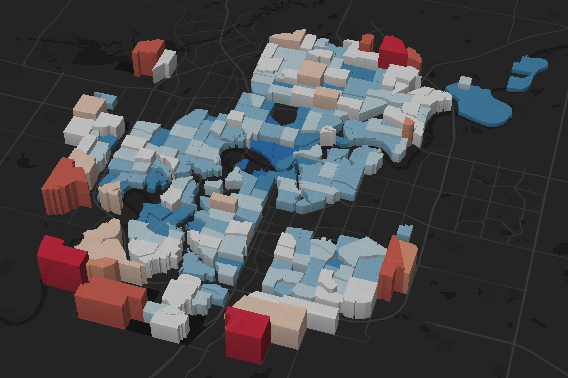
… after which the user can then browse and compare neighborhoods with each other in the city, including their own. Storytelling makes the insights more accessible, while the 3D map is an effective way of creating engagement.
Combining Technologies
Another goal for this project was to build on existing tools that are familiar to data scientists. In particular, the charts on the right are built with Tableau and hosted on Tableau Public, building off concepts from a dashboard that the City of Edmonton had previously created.
One of the challenges was to create dashboards in a way that did not seem like a typical Tableau workbook, and to integrate them seamlessly with libraries and tools to make storytelling and mapping possible.


