
… but I sense some in the audience would appreciate a refresher course.
Test:
- Group “A” receives all emails in the next month (i.e. 25 contacts).
- Group “B” receives some emails in the next month (i.e. 10 contacts).
- Group “C” receives no emails in the next month (0), though I realize some of you find this unpalatable, so you could make it a small number (i.e. 4, one per week).
Results:
- Measure total spend after a month, at a customer level.
- Group “A” = $25.00.
- Group “B” = $23.00.
- Group “C” = $20.00.
Adjusted Results:
- We adjust for the fact that the customer would have spent $20.00 no matter what … that’s the organic amount.
- Compared to Group “A”, your organic percentage is 20/25 = 80%.
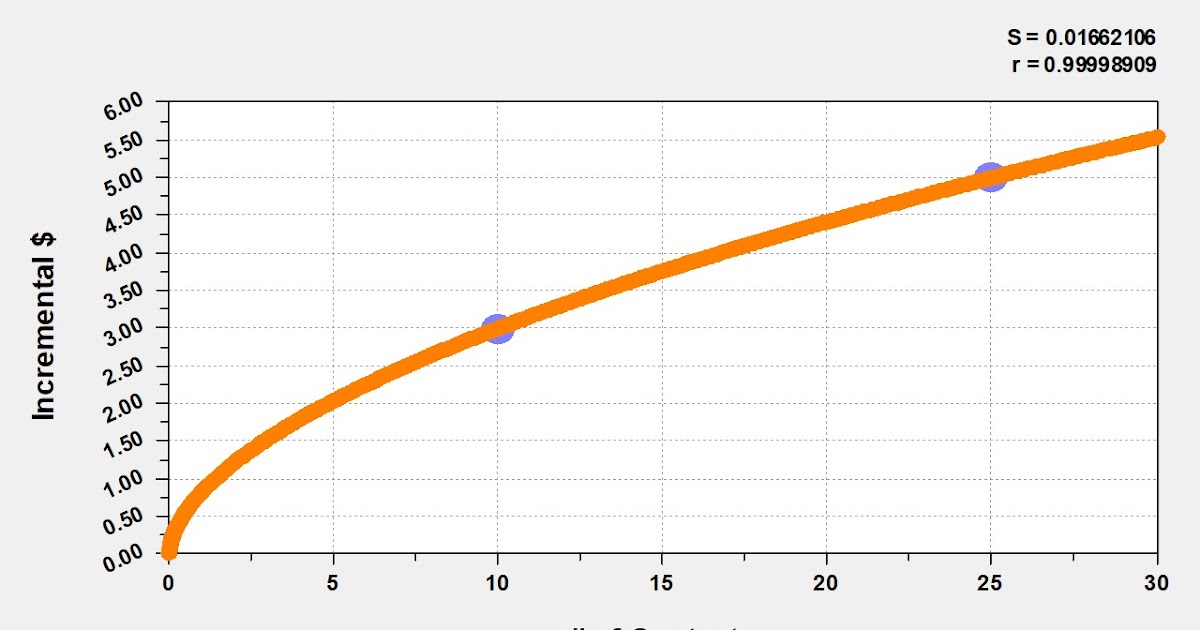
- Group “A” = $25.00 – $20.00 = $5.00.
- Group “B” = $23.00 – $20.00 = $3.00.
- Group “C” = $20.00 – $20.00 = $0.00.
From here, we can fit the relationship with a power function.

And you now know the amount of incremental demand/sales you generate at each number of contacts in the month studied. Also, yes, I understand that your analytics guru thinks this is a poor way to design a test and then measure results. No worries. It’s important to be in “do something mode” in 2025.


