Is It Ethereum’s Time Again? ETH and ETH/BTC Technical Outlook


Ethereum had a rough beginning of 2025—failing to reach new all-time highs, while Bitcoin smashed through its own ATH multiple times. Solana, providing a cheaper alternative to ETH services, also held stronger than the Ether throughout the latter part of 2024 and beginning 2025.
ETH performance is key to the overall crypto market performance; the past Altcoin cycles have always been led by ETH performance over BTC.
ETH/BTC is a great cryptocurrency spread for a crypto trader to spot relative performance, provide a direction for which crypto to choose, and track the appetite for altcoins.
Through this Crypto Market Update, you will see how ETH/BTC rising helped altcoin bull-runs in the past cycle, something that many crypto traders have been awaiting and is yet to materialize again.
ETH/BTC and its Correlation to total Market Performance
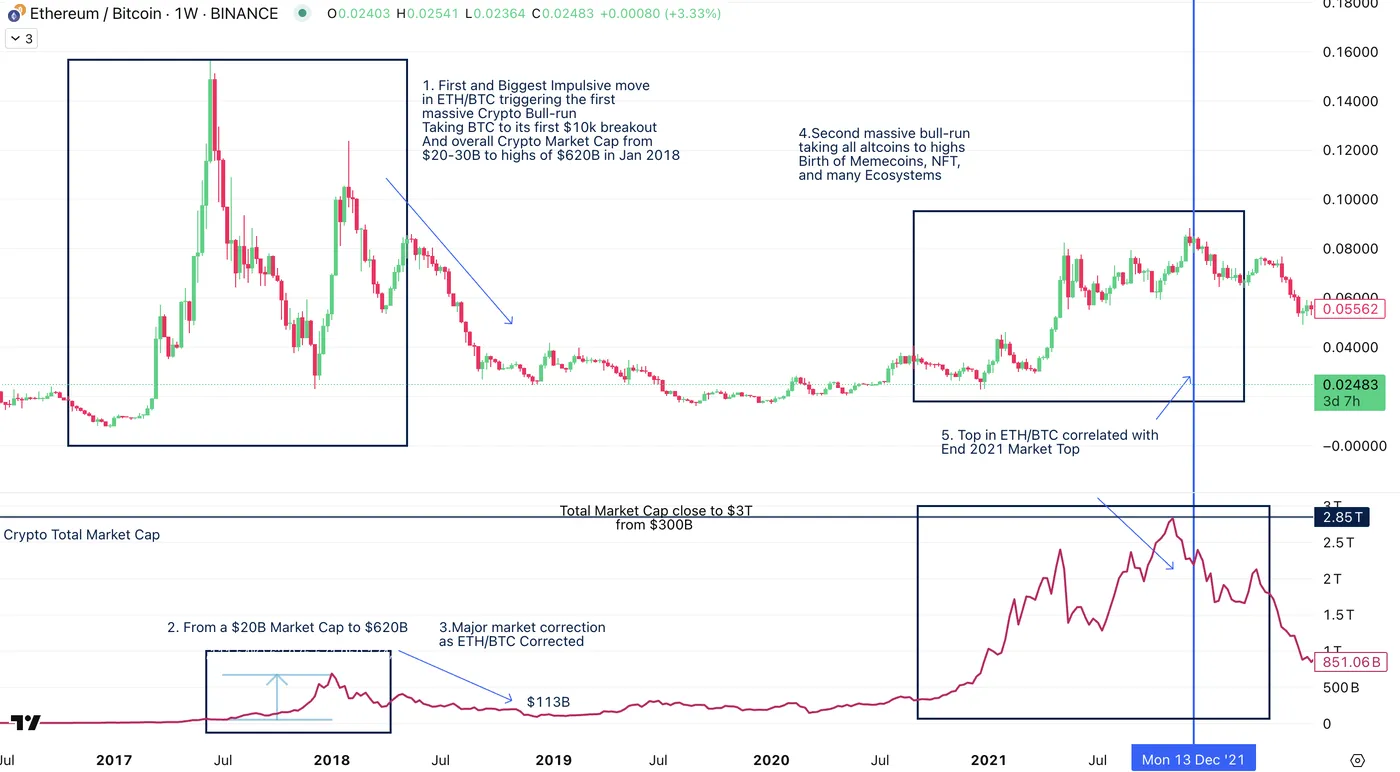
ETH/BTC and Total Crypto Market Cap, 2017 to End 2021 – Source: TradingView
This 2017 to 2021 chart of ETH/BTC contains essential information about understanding the Crypto Market.
Through 1 and 2 we observe how the first bull run in ETH and ETH/BTC led to the 2017 Total Crypto Market bull run – taking the Market Cap from $20B-$30B average to highs of $620B in November 2017.
Number 3 on the chart shows how a drop in ETH/BTC leads to a significant cool down of the Crypto Market, going back towards a total market cap between $100 to $250B from 2018 to the end of 2020.
From end 2020 to the end of 2021, number 4 shows the same correlation of ETH/BTC and Crypto markets rallying.
This Covid-Era bull run introduced crypto for an ever-bigger number of investors, and led to the flurry of altcoins and cryptocurrency projects such as Doge, Avax, Solana. The Crypto Market cap went from $300B to $2.86T, this level only got reached again in November 2024.
Finally, number 5 shows similarly to number 3 how the drop in Market Cap correlates with a drop in the ETH/BTC spread.
ETH/BTC from 2020 to Today
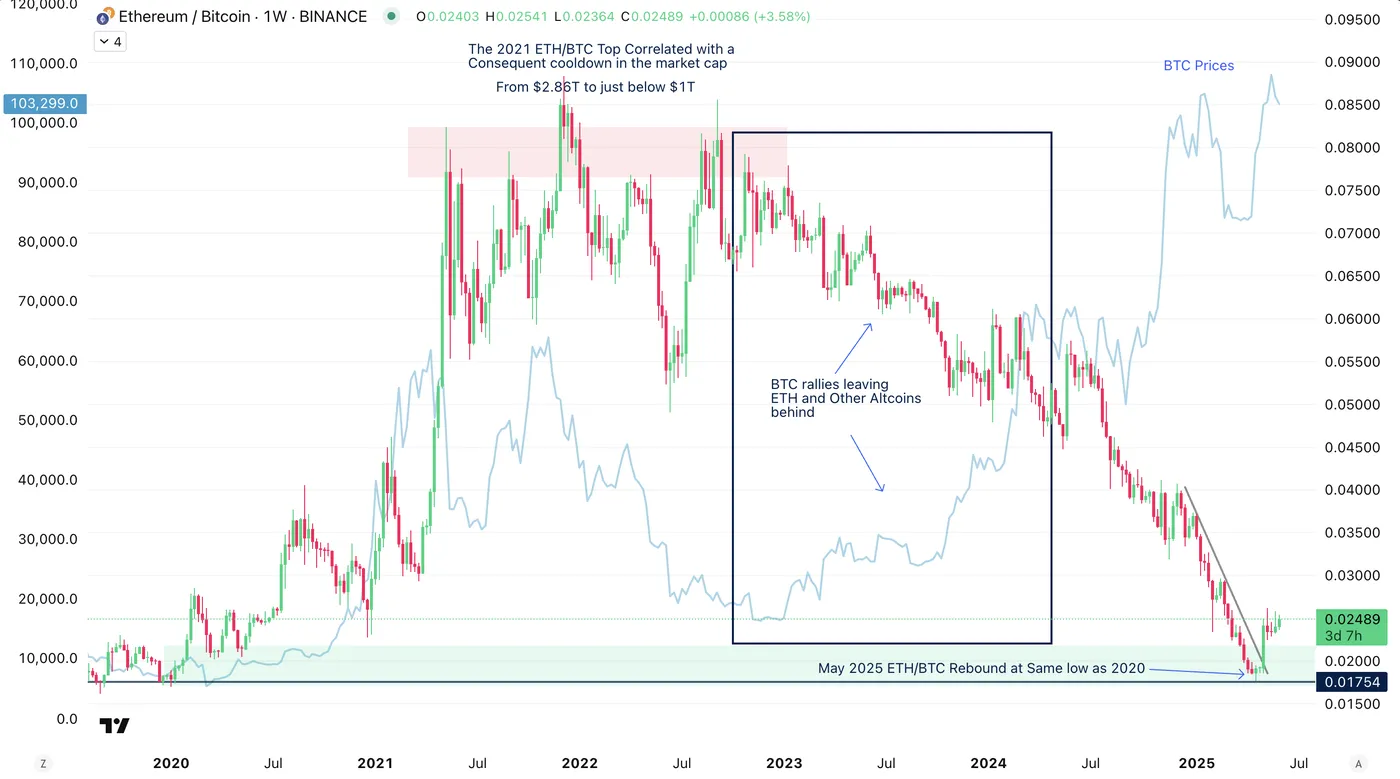
ETH/BTC and Bitcoin, 2020 to June 5, 2025 – Source: TradingView
We take a closer look at the 2021 Bull Run and how the December 2021 top in ETH/BTC led again a significant correction in the Crypto Market.
2023 was all about Bitcoin Dominance as its rally from $14,475 to its record highs of $112,030 left Ethereum and all other altcoins lagging.
We are seeing a breakout from the descent that started at the same level as the 2020 ETH/BTC bullish breakout – we will see if the spread continues upward and if it generates another Bull Run for altcoins.
ETH Daily Chart
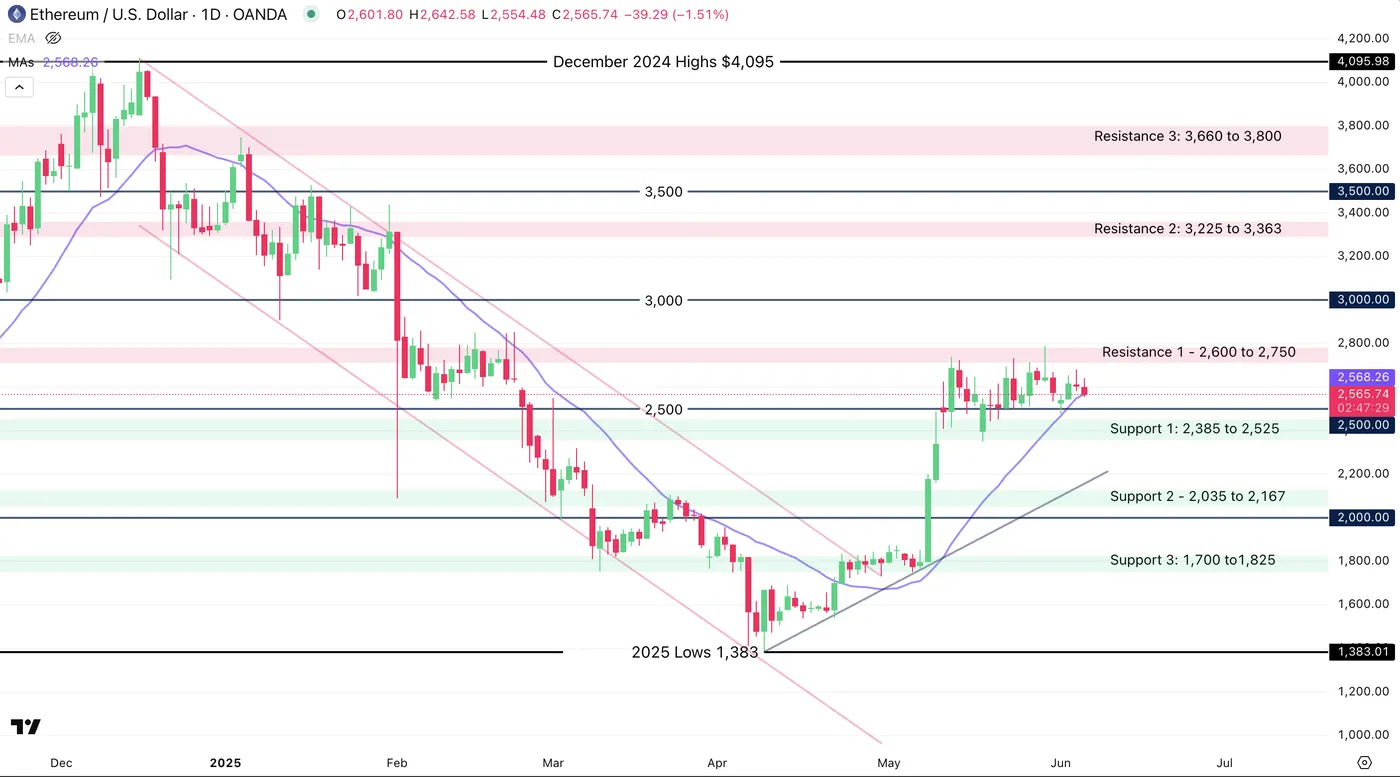
ETH Daily Chart, June 5, 2025 – Source: TradingView
ETH had a consequent rally after a significant drop between $4,000 highs in December 2024 to $1,363 lows in April 2025.
Prices are consolidating between $2,300 and $2,600 – The key is to see if Bitcoin prices that are also stagnating above the $100,000 Mark leads to rallies in other cryptos as the same phenomenon happened in past bull cycles.
Levels to watch:
Support Zones:
- S1: 2,385 to 2,525
- S2: 2,035 to 2,167
- S3: 1,700 to 1,825
Resistance Zones:
- R1: 2,600 to 2,750
- R2: 3,225 to 3,363
- R3: 3,660 to 3,800
ETH 4H Chart
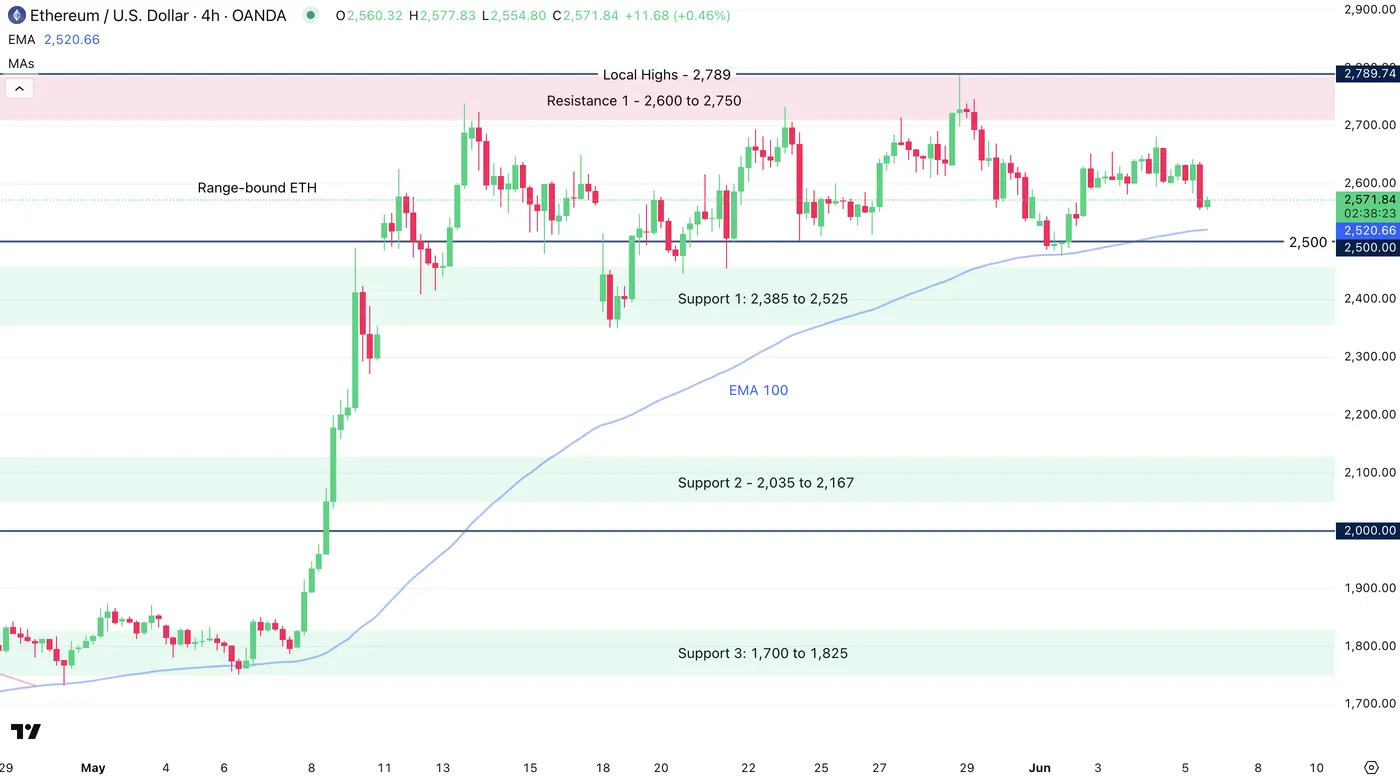
ETH 4H Chart, June 5, 2025 – Source: TradingView
Safe Trades!