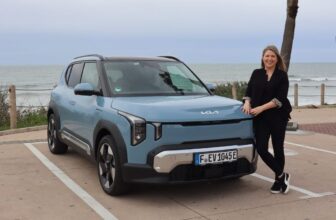
Kia Carnival
Here you will find monthly and yearly United States and Canadian sales figures for the Kia Carnival. The Carnival is Kia’s three-row minivan, sold in North America as the Sedona from the 2002 through 2021 model years and renamed Carnival for the 2022 model year to match the name Kia uses in the rest of the world. The charts below follow the nameplate continuously across both names, so the earlier years are Sedona deliveries and the recent years are Carnival deliveries. It competes with the Honda Odyssey, Toyota Sienna and Chrysler Pacifica.
Specifications
- Class: Minivan, marketed by Kia as an MPV
- Current engines: 3.5L V6 gasoline direct injection (Lambda III), rated 287 horsepower at 6,400 rpm and 260 lb-ft at 5,000 rpm; Carnival Hybrid pairs a 1.6L turbocharged gasoline direct injection four-cylinder with a permanent magnet synchronous motor
- Transmission: 8-speed automatic on the V6, 6-speed automatic on the hybrid
- Drivetrain: Front-wheel drive, with no all-wheel-drive variant offered
- Trims: LX, LXS, EX, SX and SX Prestige on the V6; LXS, EX, SX and SX Prestige on the hybrid
- Chief rivals: Honda Odyssey, Toyota Sienna, Chrysler Pacifica
Kia added the Carnival Hybrid for the 2025 model year alongside a mid-cycle update, and it now accounts for a large share of the nameplate’s volume.
Kia Carnival Sales in the United States
Kia’s minivan has had two distinct lives in the United States, and this chart shows both. Sedona volume climbed quickly after the 2001 launch to a first peak of 61,149 units in 2004, then drifted down through the second half of the decade and bottomed at 7,079 units in 2013 as the outgoing generation ran out. A new Sedona lifted the line back to 36,755 units in 2015 and 44,264 in 2016, but the slide resumed and 2021 closed at 10,530, the quietest full year in the chart. The Carnival name arrived for the 2022 model year and the recovery since has been the steepest stretch here: 17,075 units in 2022, 43,687 in 2023, 49,726 in 2024 and 86,641 in 2025, the highest full-year total on the chart. Momentum has carried into 2026. Through August, Kia had delivered 54,736 Carnivals, about 20 percent ahead of the 45,602 sold over the same eight months of 2025, with May the strongest single month at 8,062 units.
2025 full year
86,641
▲ 74.2% vs 2024
2026 YTD (Jan–Aug)
54,736
▲ 20.0% vs same period 2025
Total on record
869,901
all years
Kia Carnival, United States calendar-year unit sales, 2001–2026. 2026 is January–Aug (partial).
Annual sales
| Year | Units | YoY |
|---|---|---|
| 2001 | 15,069 | — |
| 2002 | 39,088 | ▲ 159.4% |
| 2003 | 50,628 | ▲ 29.5% |
| 2004 | 61,149 | ▲ 20.8% |
| 2005 | 52,837 | ▼ 13.6% |
| 2006 | 57,018 | ▲ 7.9% |
| 2007 | 40,493 | ▼ 29.0% |
| 2008 | 26,915 | ▼ 33.5% |
| 2009 | 27,398 | ▲ 1.8% |
| 2010 | 21,823 | ▼ 20.3% |
| 2011 | 24,047 | ▲ 10.2% |
| 2012 | 17,512 | ▼ 27.2% |
| 2013 | 7,079 | ▼ 59.6% |
| 2014 | 14,567 | ▲ 105.8% |
| 2015 | 36,755 | ▲ 152.3% |
| 2016 | 44,264 | ▲ 20.4% |
| 2017 | 23,815 | ▼ 46.2% |
| 2018 | 17,928 | ▼ 24.7% |
| 2019 | 15,931 | ▼ 11.1% |
| 2020 | 13,190 | ▼ 17.2% |
| 2021 | 10,530 | ▼ 20.2% |
| 2022 | 17,075 | ▲ 62.2% |
| 2023 | 43,687 | ▲ 155.9% |
| 2024 | 49,726 | ▲ 13.8% |
| 2025 | 86,641 | ▲ 74.2% |
| 2026 (Jan–Aug) | 54,736 | ▲ 20.0% YTD |
Monthly sales
Kia Carnival Sales in Canada
The Canadian chart is a shorter story because it begins with the Carnival itself. Deliveries open in April 2021 and close that partial year at 4,125 units, then fall to 2,307 in 2022 as supply tightened across the segment. Volume recovered to 6,406 units in 2023, the strongest full year here, eased to 4,465 in 2024 and returned to 5,645 in 2025. 2026 has been the clearest step up yet: the 5,973 Carnivals delivered through August already exceed the whole of 2025 and sit about 45 percent ahead of the 4,113 recorded over the same months last year, helped by a June that reached 1,533 units.
Kia Carnival, Canada calendar-year unit sales, 2021–2026. 2026 is January–Aug (partial).
Annual sales
| Year | Units | YoY |
|---|---|---|
| 2021 | 4,125 | — |
| 2022 | 2,307 | ▼ 44.1% |
| 2023 | 6,406 | ▲ 177.7% |
| 2024 | 4,465 | ▼ 30.3% |
| 2025 | 5,645 | ▲ 26.4% |
| 2026 (Jan–Aug) | 5,973 | ▲ 45.2% YTD |
Monthly sales