Whole Life Insurance · Where It Fits
Short Answer
Is whole life insurance better than a savings account, CD or money market fund? Neither is better. They do different jobs. Cash follows short-term interest rates and resets within weeks, which makes it right for money you’ll spend in the next few years. A whole life policy is backed by long-term bonds, so it moves slowly in both directions, and it adds a guaranteed floor that rises every year and a death benefit. The useful question is which of your dollars belong where.
Cash pays real interest again. The Federal Reserve raised its target rate on September 16, 2026, to a range of 3.75% to 4.00%, its first increase since 2023. The best savings accounts pay a little over 4% as of early October. If you’re shoveling money into a money market fund right now, it isn’t so bad.
We see what that does to people. For as long as we’ve done this, the number of people asking us about whole life insurance has risen and fallen with short-term interest rates. When cash pays, the question gets harder to answer in your own head: why commit money to a policy when a savings account pays this well for doing nothing?
It’s a fair question, and we’re not going to answer it by lining up one rate against another. That comparison leaves out most of what matters. We’d rather tell you a story, because all of this has happened before. In the late 1970s, people moved money out of whole life and into money market funds by the billions. Then the two traded places.
Staying in Our Lane
We work only with cash value life insurance and fixed annuities. Nothing here is investment advice, and nothing here is a forecast of interest rates or dividends. The history below shows how two kinds of money have behaved. It doesn’t predict what either will do next. Dividends are not guaranteed.
Quick Reference
The Whole Post in Five Lines
- Cash won once before. Money market funds grew from about $4 billion to about $186 billion in four years as Treasury bills climbed past 10%. Whole life dividends were well behind.
- Then they traded places. By 1986, Treasury bills were back near 6% and one large mutual company’s dividend interest rate had risen every year to 11.25%.
- Whole life is slow in both directions. Insurers buy long-term bonds every year and hold them, so dividends trail on the way up and hold on longer on the way down.
- The rate isn’t the whole comparison. A policy also has a guaranteed floor that rises every year and a death benefit. Cash has neither.
- Cash still wins for near-term money. Reserves and anything you’ll spend in the next several years belong in cash.
The Last Time Cash Won: 1979
Inflation was running hot at the end of the 1970s. Consumer prices rose more than 13% during 1979, according to Bureau of Labor Statistics data, and short-term interest rates went up to fight it. Money market funds, which mostly hold very short-term debt like Treasury bills, went from a curiosity to a phenomenon.
The numbers are hard to believe now. Federal Reserve data shows about $3.9 billion in money market funds at the end of 1977. Two years later there was $45.2 billion. Two years after that, $186.3 billion. The reason was simple. The three-month Treasury bill averaged about 10% in 1979 and about 14% in 1981. That’s $10,000 a year on every $100,000, for parking it somewhere with very little risk to your principal.
Whole life wasn’t close. Northwestern Mutual has published its dividend interest rate for every year back to 1872, and its history shows 6.60% for 1979. So people did the sensible-looking thing. Some surrendered their policies. Many more borrowed against their cash value at the low fixed loan rates written into older contracts (8% at Northwestern in those years) and put the money in a fund paying more than that.
The insurance industry had a name for it: disintermediation, a fancy economics term for money walking out the door and not stopping. It shook the business badly enough to produce an entirely new product, which is the story we tell in why universal life insurance was built.
Were those people wrong? Not at the time. When short-term rates shoot up fast, cash wins the race for a while. That’s the honest reading of 1979, and it would be the honest reading today.
Then the Two Traded Places
Money market rates go up quick, and they come down quick. As inflation settled, Treasury bill rates fell from their 1981 peak to about 6% by 1986. Whole life went the other way. Northwestern’s dividend interest rate rose every single year from 1979 to 1986, when it reached 11.25%. In 1991 it was still 10.00%, and Treasury bills were paying a little over 5%.
TIPB Analysis
Two kinds of money, 1977 to 1995
Annual averages. Public data, no projections.
Three-month Treasury bill (what cash follows)
Northwestern Mutual dividend interest rate
Sources: Federal Reserve (three-month Treasury bill, secondary market, annual average of monthly rates) and Northwestern Mutual’s published dividend interest rate history for cash value policies. The dividend interest rate is not a policy’s rate of return: it is applied before insurance and expense charges, so actual cash value growth is lower. From 1982 on, the published rate applies to policies with no loans. Past rates do not predict future rates. Dividends are not guaranteed.
Three cautions before anyone reads too much into that picture. First, a dividend interest rate is not what a policyholder earned. Northwestern’s own history says plainly that it shouldn’t be used as a measure of a policy’s return, and we agree. We explain why in our 2026 dividend analysis. Second, this is one company’s published record. On the episode we said other mutual companies were in the same ballpark, each a little different, but we haven’t charted them here. Third, the 1980s are not coming back on a schedule, and we’re not suggesting they will.
What the chart does show is direction and timing. From 1981 to 1986, Treasury bills lost more than half their yield while the dividend rate kept climbing. Anyone who left whole life for a money market fund in 1979 got the better rate for about four years, and then spent more than a decade watching the thing they’d left credit more than the thing they’d left it for.
Why Whole Life Is Slow in Both Directions
There’s nothing mysterious about it. An insurance company takes the premiums it collects and invests them mostly in bonds. Corporate debt is the largest single piece of what life insurers own, according to the industry’s ACLI Fact Book. The company isn’t free to do whatever it likes with the money, either. It invests inside tight rules, and it buys those bonds for two purposes: to cover the guarantees in its contracts, and, at a mutual company, to pay what it earns beyond that back to policyholders as dividends.
The important part is that it buys more every year. New premium comes in, older bonds mature, and all of it gets invested at whatever rates the market is offering that year. When rates rise, each year’s purchases come in at higher yields, and the average creeps up. When rates turn around and fall, the company still owns everything it bought at the higher rates, often for ten years or longer. It keeps collecting those yields, and it isn’t much concerned with the market price of bonds it intends to hold.
Our post on how life insurers invest whole life premiums uses a picture we like. Imagine your grandmother left you a stack of twenty CDs, one bought every year for twenty years. Each year one matures and you replace it at today’s rate. When rates rise, your average drifts up slowly. When they fall, it drifts down just as slowly. A savings account, by comparison, is one CD that renews every night.
It worked the same way on the way down
At the end of 2008, the Federal Reserve cut its target rate to essentially zero. Cash stopped paying almost overnight and stayed that way for years. Whole life didn’t move like that. Northwestern’s published rate was 7.50% for 2008, 6.50% for 2009 and 6.15% for 2010. We were both in the business at the time, and we don’t remember a single company slashing its dividend the way savings rates were slashed. Some lowered their scales for 2009, a few by more than the rest, and some didn’t lower them at all.
We’ll say the other half too, because it’s the same mechanism. When rates stayed low for most of the next decade and more, dividends kept drifting down the whole time. No company has any magic to work against that. Slow on the way up means you trail for a while. Slow on the way down means the decline is gradual, and it still happens.
Two Clocks
Here’s the idea the history is really about. Cash and whole life both pay you something for holding them, but they’re attached to different machines, and those machines keep different time.
The fast clock
Cash
- Savings accounts, CDs, Treasury bills, money market funds.
- Follows short-term rates, which follow the Fed.
- Resets within weeks, up or down.
- You get today’s rate today and tomorrow’s rate tomorrow.
- Exactly right for money you’re going to spend.
The slow clock
A whole life policy
- Backed by a portfolio of long-term bonds bought over many years.
- Follows the bond market, a slice at a time.
- Takes years to move, up or down.
- Comes with a guaranteed floor and a death benefit.
- Built for money you won’t touch for ten years or more.
The rate on your money market fund tells you what time it is on the first clock. It tells you nothing about the second. That’s why “which one pays more right now?” is the wrong question. The better question is which clock each of your dollars should be on. Money you’ll spend soon belongs on the fast one, and cash is perfect for it. Money you won’t touch for a decade, sitting in cash because the rate feels good this month, is a different matter.
What Comes With the Slow Clock
If the only difference were timing, this would be a short conversation. A whole life policy does things a cash account doesn’t, and none of them shows up when you compare one rate with another.
A floor that only moves up
A savings account promises your balance, plus whatever the bank decides to pay next month. A CD promises a rate until it matures, and then you start over. A whole life policy has a guaranteed cash value that rises every year for as long as you own it, and that floor doesn’t depend on what anyone at the Fed does.
There’s a part of this that even some advisors misread. The guaranteed column on a whole life illustration shows what happens if the policy never pays a single dividend. The first time a dividend is paid and used to buy paid-up additions, every guaranteed number printed after that point is out of date, because that cash is now part of the guaranteed cash value. The contract’s guaranteed growth is then calculated on a bigger base.
We once talked with a policy owner who had taken an in-force ledger to a supposed expert. The expert noticed that the guaranteed cash value and the current cash value in the first year of the ledger were basically the same, and concluded that the owner had earned nothing better than the guarantee over the ten years they’d held the policy. Since the guaranteed column on the original illustration was the bad column, the owner walked away thinking they’d been had. That reading is backwards. The two numbers match because all of the cash in an in-force policy is guaranteed cash. Ten years of dividends had raised the floor.
So if a period of higher rates lifts dividends for a stretch, the benefit doesn’t vanish when rates fall again. The guarantee keeps working on a larger pile of money. People who favor indexed universal life like to talk about its floor and its annual lock-in. Whole life has something similar. (We like both products, for what it’s worth.)
One thing we won’t claim is that cash is risky. Bank deposits are FDIC insured up to $250,000 per depositor, per bank, per ownership category. Money market funds aren’t FDIC insured, though losses in them have been rare. The difference between cash and a policy isn’t the safety of your principal today. It’s what has been promised about the future.
A death benefit
It’s life insurance, and that gets skipped constantly when the conversation is about cash value. A savings balance is what you put in plus interest. A policy carries a death benefit from the day it’s issued. On the well-built $50,000-a-year design in our buyer’s guide, the death benefit starts at $1,037,789.
Here’s where that matters to someone holding a lot of cash. We’ve had this conversation many times: someone tells us they want to spend as much as possible in retirement, we show them how, and then they ask how much will be left for the kids. That depends on when they die, and it wasn’t what they asked for. A death benefit answers the question in advance. It replaces dollars you spend down, which matters most to married couples and to anyone who wants to leave something behind. And it gives you options when you get to retirement, because you don’t need every other account to cooperate in the year you happen to retire.
A way to use the money without spending it
When you spend cash, it’s gone, and so is the interest it would have earned. When you borrow against a policy, the insurance company lends you its own money and holds your cash value as collateral, so your cash value keeps doing what it was doing. How policy loans work covers the mechanics.
We’ll be straight about the limit. A policy loan is not cheap money right now. Loan rates tend to follow corporate bond yields, and today that puts them above what the best savings accounts pay. This feature is about keeping your money working while you use it. It isn’t about borrowing at a bargain, and it does the most for people who would be borrowing anyway, which is the argument we make in does infinite banking work.
The Policy That Missed Its Illustration and Still Did Well
This history is also where one of the oldest criticisms of whole life comes from. People who bought in the late 1980s and early 1990s were shown illustrations built on dividend scales near their peak, and those dividends didn’t last. The policies fell short of what was printed. That part of the criticism is true.
What it leaves out is that many of those owners still did well. Years ago, someone shared the actual year-by-year results of a policy bought in the early 1990s, one designed much the way we’d design it today, with a blend of base premium and paid-up additions. It never matched its illustration. Through the mid-2000s it had still produced a result that would surprise most critics of whole life, because of when the owner held it. We don’t have its numbers since then, and they’d be lower today after the long stretch of low rates.
We read that as an argument for holding illustrations loosely, and for understanding what drives them. If you have one in front of you, how to read a whole life illustration walks through five checks.
Where Cash Wins
We mean this part. Nobody should hear any of the above as a reason to empty a money market fund, and nobody should put everything they have into whole life.
| This money | Belongs in | Why |
|---|---|---|
| Your emergency reserve | Cash | A policy is not an emergency fund. Reserves come first. |
| Anything you’ll spend in the next few years | Cash, CDs or Treasury bills | A house, a tax bill, tuition. This is exactly what the fast clock is for. |
| Money with a horizon under ten years | Cash or other short-term savings | A whole life policy’s early years carry its costs. Giving one up after only a few years is the worst way to own it. |
| Money you want to beat the stock market | A conversation with your investment advisor | Whole life won’t do that, and it isn’t trying to. |
| Long-term money you’ve decided to keep safe | Possibly a policy, in part | If you save steadily, won’t need it for ten years or more, and want a layer that stays put, this is the money whole life was built for. |
Two more things, and neither has anything to do with life insurance. If your cash is in a big-bank savings account, check the rate. The FDIC’s national average for savings accounts was 0.37% as of September 21, 2026, while the best accounts were paying about 4.25% in early October. Moving it costs you an afternoon. And please don’t buy whole life because someone called it a better savings account. It isn’t one. It’s a different tool that does different jobs.
Practitioner Take
The Rate Tells You What Cash Pays You for Waiting
It doesn’t tell you where your long-term money belongs. That’s the whole lesson of 1979. The people who moved were right about the rate and wrong about what the rate was measuring.
On the episode, Brandon said he’s moderately excited about what a period of higher rates could mean for the policies he owns. He knows roughly what they project at 65, and rising dividends from here would add to it. That’s one owner’s opinion, and it isn’t a forecast. Nobody knows what rates do next. If short-term rates keep climbing, cash will keep winning the rate race for a while, and whole life will trail. We’ve told you why.
If You’re Thinking About Moving Cash Into a Policy
Most people in this position are holding a lump sum, and the instinct is to put it in all at once. That’s the most common mistake we see. Put too much into a policy too fast and it becomes a modified endowment contract, which costs it the tax treatment that made it worth doing. So the money goes in over several years, inside that limit. Having all the money today doesn’t mean it all belongs in the policy today.
That turns out to settle the either-or question. In an example from our post on blended whole life, a man we call Fredrick has $400,000 sitting in a money market account. It goes into a policy at about $57,000 a year over seven years. The money market account doesn’t go away. It becomes the source of the premiums, and whatever hasn’t gone in yet stays there, earning the cash rate, until its turn.
Our rule of thumb is simple. If the cash has a job, like a reserve, a purchase or a tax bill, it stays in cash. If it’s sitting around waiting for a use and you don’t expect to need it for a decade, a policy is a reasonable place for part of it. And expect the first few years to be dull. A policy judged in year three will always disappoint someone who expected it to behave like a savings account. How to buy whole life insurance covers what a good design looks like.
Hypothetical example for illustrative purposes only. Individual results vary based on specific products, timing, and personal circumstances.
Frequently Asked Questions
Is whole life insurance better than a savings account or a CD?
Neither is better, because they do different jobs. Savings accounts, CDs and money market funds follow short-term interest rates and are the right place for money you will spend in the next few years. A whole life policy is backed by a portfolio of long-term bonds, so its dividends move slowly in both directions, and it adds a guaranteed cash value floor that rises every year and a death benefit. It suits money you will not need for ten years or more.
What happened to whole life insurance when interest rates spiked in the late 1970s?
Money left whole life for money market funds. Money market fund assets grew from about $4 billion at the end of 1977 to about $186 billion at the end of 1981 as Treasury bill rates climbed above 10%. Policyholders surrendered policies or borrowed against them at low fixed loan rates. The industry called it disintermediation. By the mid-1980s the positions had reversed: Treasury bill rates had fallen to about 6% while some whole life dividend interest rates had climbed above 10%.
Do whole life dividends go up when interest rates rise?
Usually, but slowly. Insurers invest premiums mostly in long-term bonds and buy more every year, so higher rates work into the portfolio a slice at a time. Dividends tend to trail on the way up and hold on longer on the way down. Dividends are not guaranteed, and they can fall.
Is the dividend interest rate the return on a whole life policy?
No. The dividend interest rate is one input in the dividend calculation, applied before the cost of insurance and expenses. A policy’s actual cash value growth will be lower than the dividend interest rate, especially in the early years. Use the rate to see direction and timing, not as a yield you can compare with a savings account.
Is the cash value in a whole life policy guaranteed?
Yes, within the contract. A whole life policy has a guaranteed cash value that rises every year. Dividends are not guaranteed, but once a dividend is paid and used to buy paid-up additions, that cash value becomes part of the guaranteed base going forward. Guarantees depend on the claims-paying ability of the insurance company.
Is cash value as safe as money in the bank?
They are protected in different ways. Bank deposits are insured by the FDIC up to $250,000 per depositor, per bank, per ownership category. Money market funds are not FDIC insured. Whole life guarantees are backed by the insurance company, with state guaranty associations as a limited backstop whose coverage limits vary by state. Bank principal is safe today; a policy’s guarantee is a promise about every future year as well.
Should I move my savings or money market balance into whole life insurance?
Only the part you will not need for at least ten years, and not all at once. Emergency reserves and money with a job in the next few years should stay in cash. A lump sum also has to go into a policy over several years to stay under the modified endowment contract limit, so the cash you have not moved yet stays in cash until its turn.
Cash on the sidelines?
Tell us how much and what it’s for
Everything above is general, and your situation isn’t. Tell us a few things about where you stand, including roughly how much cash you’re holding and what it’s for. Brandon will build a design at your numbers and send you a private video walking through it page by page, within two business days. We’ll tell you what should stay in cash and what might belong in a policy. If whole life isn’t the right tool for you, the video will say so.
- Built at your numbers
- Private video walkthrough
- No call, no pitch

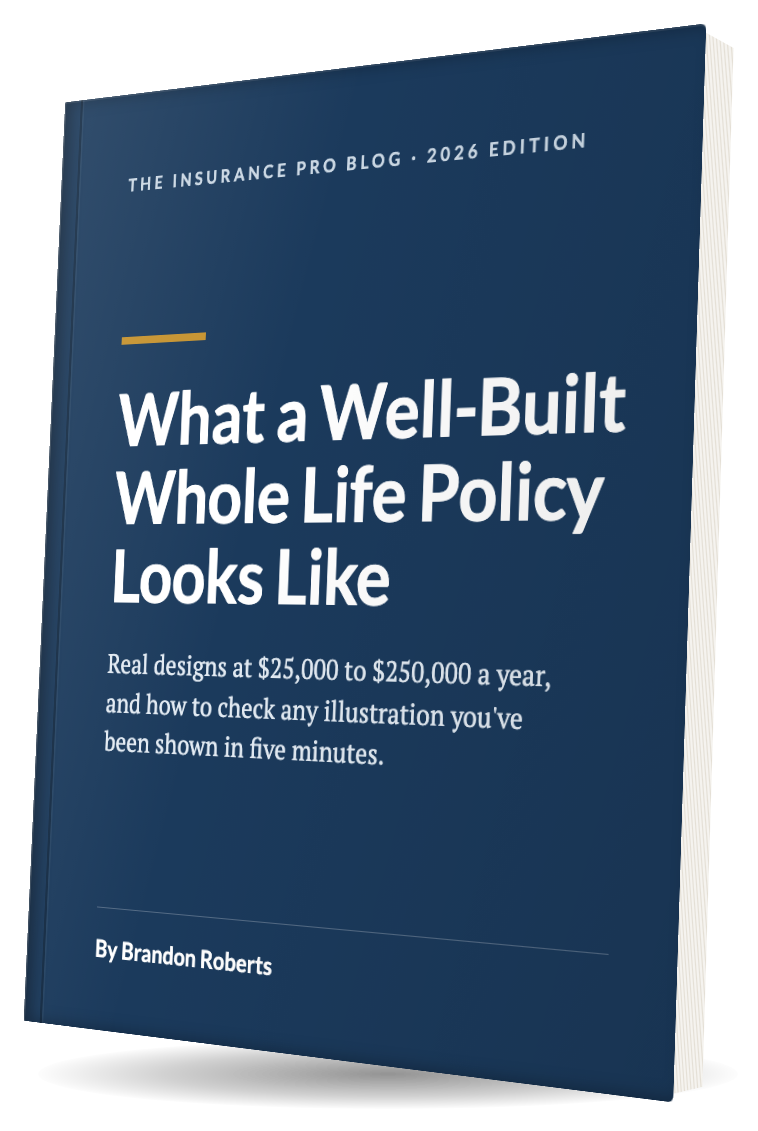
Not ready for your own numbers yet? The free buyer’s guide shows what a well-built policy looks like at $25,000 to $250,000 a year, with what’s guaranteed and what isn’t.
Historical interest rates and dividend interest rates are shown for education only and do not predict future results. A dividend interest rate is not a policy’s rate of return. Dividends are not guaranteed and may be lower or higher than in the past. Cash rates cited are as of the dates shown and change often. Hypothetical examples are for illustrative purposes only. Individual results vary based on specific products, timing, and personal circumstances. Product suitability depends on individual circumstances including age, health, income needs, time horizon, and existing assets. This is general education, not a recommendation for any specific product, and not tax or legal advice. Policy loans accrue interest and reduce the cash value and death benefit; a policy that lapses or is surrendered with a loan outstanding can create taxable income. Guarantees are subject to the claims-paying ability of the issuing insurance company. Bank deposits are FDIC insured up to applicable limits; life insurance and money market funds are not. We specialize in cash value life insurance and fixed annuities, and do not advise on securities.