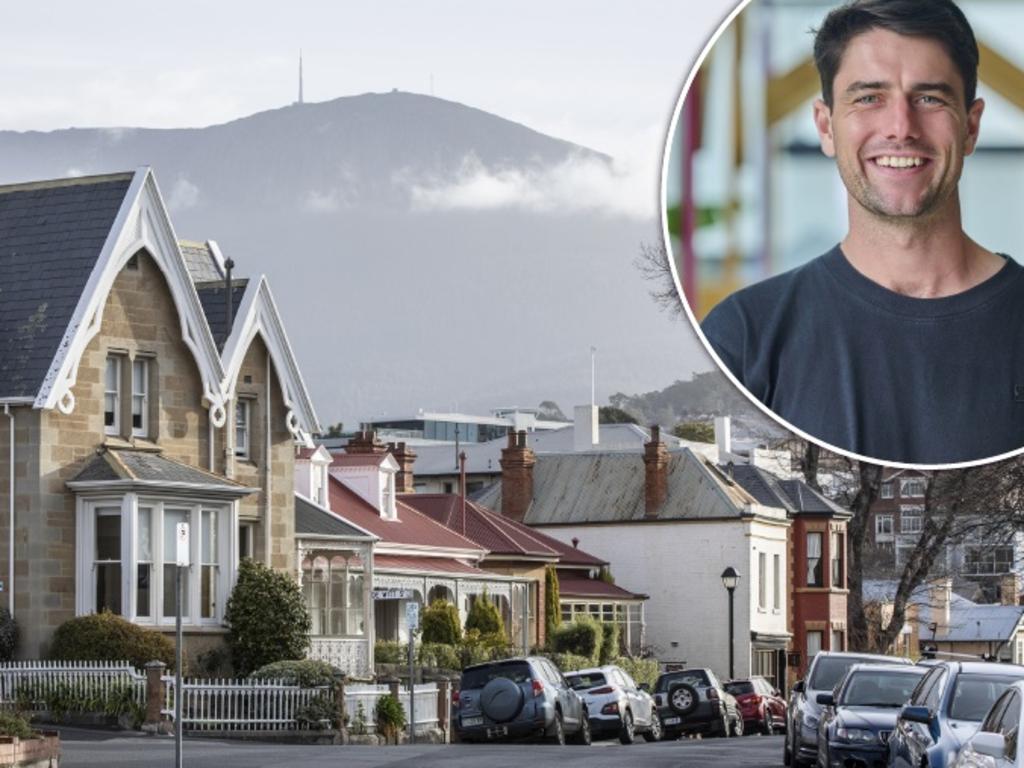

realestate.com.au economist Luc Redman and Tassie’s leading suburb Battery Point. Picture: Supplied
Battery Point first, Sandy Bay second — or vice versa.
This is how Tasmania’s home price charts tend to rank our most expensive suburbs.
But new research by realestate.com.au has thrown a spanner in those works.
When assessing the market by a property’s asking price per square metre instead of the usual median value or highest sale price, economist Luc Redman found one of Hobart’s usual gold and silver medallists had fallen from the podium.
Perhaps unsurprisingly, blue-chip Battery Point houses remained at No.1. But Sandy Bay slipped to fifth.
The data analysed suburbs on their mean price per square metre, calculated by dividing listing asking prices by a property with a house’s land size or a unit’s floor area.
Battery Point cost $5844 per sq m, while Sandy Bay was $2358.
The land size gap between the two is clear — often compact in Battery Point compared to larger in neighbouring Sandy Bay.
MORE: Architect’s touch brings 1810 home into modern era
Popular South Hobart home smashes suburb’s selling timeline
Sight unseen: WA buyers snap up famous Tasmanian ruin

Battery Point and the river, a winning combination.
Compared to other markets, Battery Point was more expensive than the Top 10 ACT and NT suburbs.
It was just $143 below WA’s tenth-place suburb, South Fremantle.
Battery Point would crack the Top 3 if relocated to SA, and could crack the Top 10 in QLD.
However, Tassie’s highest price was well short of NSW and Victoria, where the tenth most-expensive suburbs were $8696 per sq m in Port Melbourne and an eye-watering $19,374sq m in Bondi Junction.
Battery Point’s hold on the Tassie home pricing crown is not new.
In 2014, when then Real Estate Institute of Tasmania president and agency chief executive Adrian Kelly AM told the Mercury that the suburb was Hobart’s No.1 for several reasons. And they hold true today.
“People want to live there just because it is Battery Point,’’ he said.
“Some of Tasmania’s oldest homes are in Battery Point and people buying in that price range will be able to afford any extensive renovations that they can dream up.
“Perhaps most importantly, capital growth has always been magnificent in Battery Point.’’
In 1996, the median price for a house in Battery Point was $210,000.
Today, realestate.com.au figures show it is over $2m. This milestone was reached following growth of over 40 per cent year-on-year, which was more than anywhere in Tasmania.
MORE: Creepy TAS town lures buyers with $220k homes
Big banks hike rates days from RBA decision
Tas Govt-leased building sells in one of year’s biggest deals
In 2021, Petrusma Property senior consultant Tony Dion described Battery Point to the Mercury as having a “unique village vibe with unrivalled historic charm”.
He said it is a solid performing market year after year.
Mr Dion said it was “not a surprise at all” to see Battery Point topping the hot list of expensive suburbs.
He said Battery Point buyers tend to be looking for an unparalleled lifestyle close to Salamanca and Hobart’s waterfront district.
When Harcourts Hobart director Ron Henry listed a waterfront home in coveted Clarke Ave the following year, he found that potential purchasers made their inquiries hastily.
He told the Mercury that its $5m-plus price expectations were achieved about a fortnight after launch.
He noted most of the inquiry was from locals, with up to one-third of calls coming from interstate, and a Tasmanian secured the home.
No.20 Clarke Ave, Battery Point.
Mr Redman said desirable areas tend to be of higher value in general, and that scarcity tends to make these areas even more valuable.
However, across the country, this year’s downturn has been in the nation’s most expensive pockets.
“The current national downturn until this point has been driven by the higher end of the market, particularly in Melbourne and Sydney,” he said.
“The more affordable end of the market has stayed relatively buoyant as first homebuyer and investor demand has remained strong.”
realestate.com.au economist Luc Redman.
Looking at where in Tasmania the price per sq m had increased the most, greater Hobart hardly gets a look-in. Instead, regional areas dominate.
In the Kingborough and Huon council areas, Margate topped the charts with a 31.3 per cent annual increase with its asking price reaching $621 per sq m.
The next best increases were in Zeehan (24.6 per cent), Prospect Vale (21.7 per cent), Young Town (20.6 per cent) and Beauty Point (20 per cent).
South Hobart made the cut with a 19.6 per cent change.
| BEST OF THE BEST BY METRE | |||||
| Rank | Type | Suburb | Price per sq m | YoY % | |
| 1 | House | Battery Point | $ 5,844 | 4.3 | |
| 2 | House | North Hobart | $ 3,202 | -3.2 | |
| 3 | House | Launceston | $ 2,638 | -2.8 | |
| 4 | House | West Hobart | $ 2,401 | 9.6 | |
| 5 | House | Sandy Bay | $ 2,358 | 6.5 | |
| 6 | House | South Hobart | $ 1,939 | 19.6 | |
| 7 | House | New Town | $ 1,664 | -10.5 | |
| 8 | House | Tranmere | $ 1,616 | 9.5 | |
| 9 | House | Taroona | $ 1,594 | 8.1 | |
| 10 | House | Hawley Beach | $ 1,582 | 8.6 | |
| 1 | Unit | Hobart | $ 8,994 | -8.2 | |
| 2 | Unit | North Hobart | $ 8,107 | -1.9 | |
| 3 | Unit | Sandy Bay | $ 7,967 | 2.3 | |
| 4 | Unit | South Hobart | $ 7,433 | 13.5 | |
| 5 | Unit | West Hobart | $ 7,362 | 0.6 | |
| 6 | Unit | Bellerive | $ 6,965 | 12.4 | |
| 7 | Unit | Lindisfarne | $ 6,341 | 7 | |
| 8 | Unit | Blackmans Bay | $ 6,175 | 3.4 | |
| 9 | Unit | Howrah | $ 6,022 | 3.9 | |
| 10 | Unit | New Town | $ 5,990 | 1.7 | |
| Source: realestate.com.au | |||||